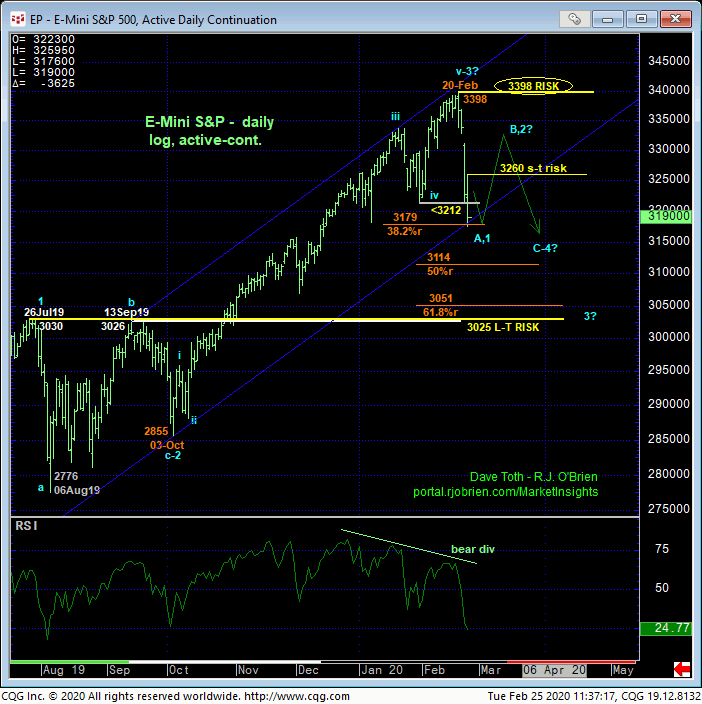
The market’s failure today below 31-Jan’s 3212 larger-degree corrective low and our key risk parameter confirms a bearish divergence in momentum that identifies last Thur’s 3398 high as one of obvious importance and the END of a 5-wave uptrend from at least 03Oct19’s 2855 low. Per such, that 3398 high serves as our new longer-term risk parameter from which non-bullish decisions like long-covers and cautious bearish punts an be objectively based and managed.
This is the bad news. Until and unless the market recoups that 3398 high needed to reinstate the secular bull, we have to acknowledge the prospect for a larger-degree correction or reversal lower.

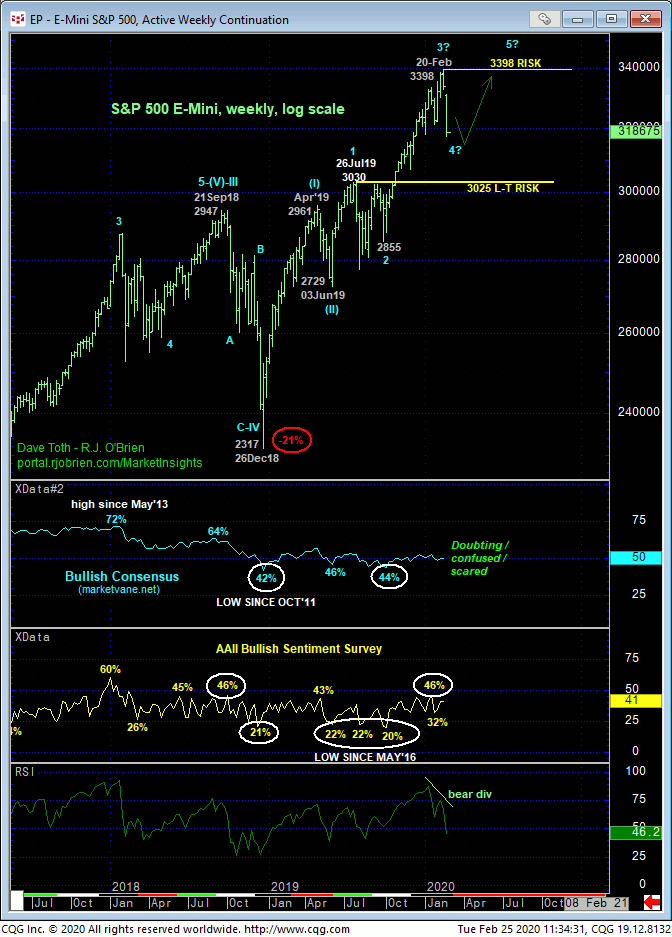
Given the magnitude of of the secular bull trend however, even today’s failure below 3212 is of an insufficient SCALE to conclude anything more than a larger-degree correction. Indeed, only a glance at the weekly log chart below is needed to see that commensurately larger-degree weakness below at least former 3030-area resistance-turned-support from Jul’19 remains required to truly threaten the secular bull and expose a bear market that could be extraordinary. What lies between 3398 and 3030, at this point, is anyone’s guess. But we have a plan (this is the start of the good news).
First of all, market sentiment/contrary opinion has floundered for QUARTERS. In the 63 weeks since Dec’18’s meltdown low of 2317 shown in the weekly log chart below, the Bullish Consensus (marketvane.net) has AVERAGED 50% and posted a high of only 57% in Apr of last year. During all this doubting-Thomas time, the bull has rallied 47% in a relatively one-way manner (although the middle-half of last year saw a lot of aimless chop). The more volatile AAII Sentiment Survey showed a bit more bullishness the past quarter or two, but we strongly suspect that both of these indicators will take a solid hit when updated tomorrow and Thurs, respectively.
It’s not beyond the realm of possibility that this time will be different and the market will establish a major peak that the huddled masses see coming so early in the peak/reversal process. But one would be hard pressed to find a previous situation where this was the case. To us, this doubtful market sentiment warns that the past week’s sharp, obvious break is either a quickie correction that’s nearly over or the initial (A- or 1st-Wave) portion of a correction that has more to go, but will include a (B- or 2nd-Wave) rebuttal that could be extensive in the period immediately ahead.

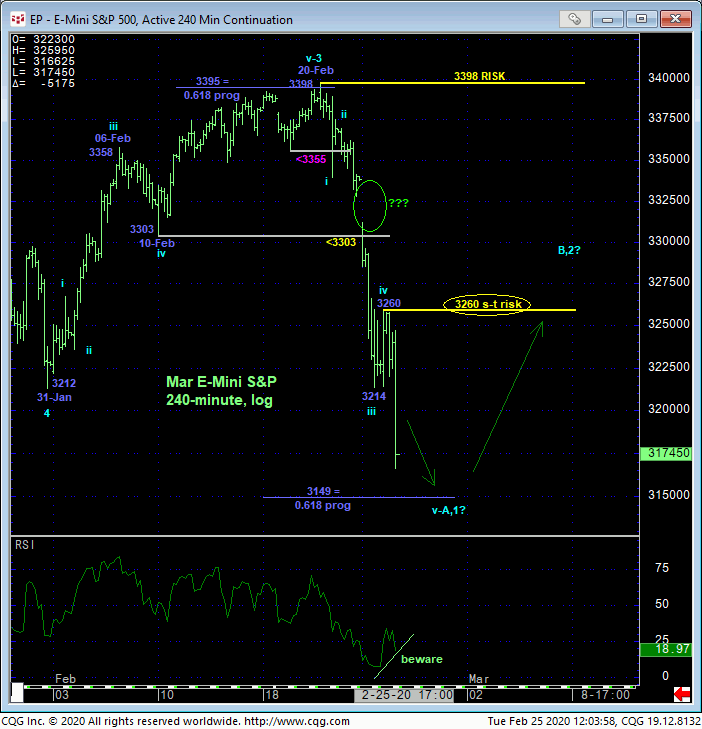
Drilling down to a 240-min chart below, this chart details the past week’s meltdown that show yesterday morning’s gap-down open, a very obvious display of weakness. Such gaps so EARLY in a peak/reversal process are unusual as the market rarely accommodates the masses chasing bearish decisions after such an obvious event; remember, an all-time high was posted just two days earlier.
What’s also typical of peak/correction/reversal processes- especially given the super-bull of all bull markets- is that an often-times extensive (B- or 2nd-wave or right-shoulder) corrective rebuttal follows the initial counter-trend break. As a result of mid-days resumed break, the market has defined this morning’s 3260 high as the latest smaller-degree corrective high the market is now required to sustain losses below to maintain a more immediate bearish count. Its failure to do so will confirm a bullish divergence in momentum that would likely mean the end of a textbook 5-wave Elliott sequence down from 20-Feb’s 3398 high. Per such, this 3260 level is considered our new short-term risk parameter from which non-bullish decisions like long-covers and cautious bearish punts can be objectively rebased and managed.
In other words, a recovery above 3260 will END the clear and present downtrend expose either an opportunistic rebound that will provide a preferred risk/reward condition around which to position for a nastier bear threat OR a resumption of the secular bull market. Until such 3260+ strength is shown, there’s no question that the longer-term trend as been exposed as down and that further and possibly accelerated losses lie ahead.
These issues considered, all previously recommended bullish policy has been negated unless you’re of a gargantuan risk profile and willing to risk exposure to at least the 3030-area and below. What we suspect however, even if the market’s on the cusp of a multi-month correction, is an eventual and potentially extensive rebound to 3300+ levels following a confirmed bullish divergence in momentum. Currently, a recovery above 3260 is required to confirm the momentum failure required to arrest the current collapse and reject/define a more reliable low and support from which bullish decisions can then be objectively based and managed. Until and unless such 3260+ strength is proven however, further losses should not surprise.


