Posted on Nov 07, 2022, 11:43 by Dave Toth
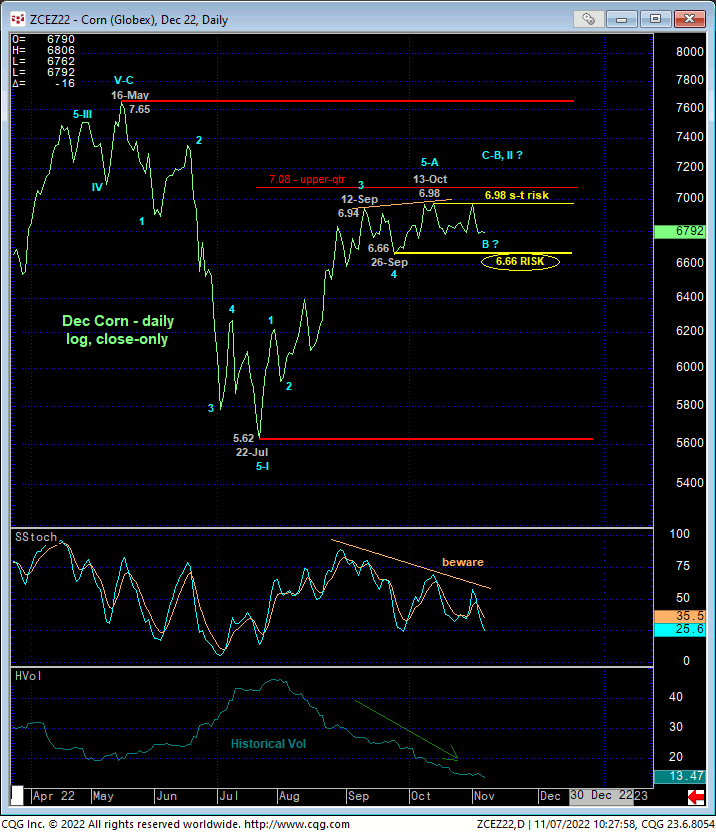
In a year in which historical volatility has been off the charts in virtually all commodities, the corn market’s residence in a mere $0.40-cent range over the past EIGHT WEEKS has been an enigma. In 17-Oct’s Technical Blog following that day’s bearish divergence in short-term momentum, we introduced a developing peak/reversal threat and identified 13-Oct’s 7.00 Globex day-session high as one of developing importance and a short-term risk parameter from which non-bullish decisions like long-covers and bearish punts can be objectively based and managed. While tested, the hourly chart below shows that that 7.00 high and risk parameter remains intact. This said, this hourly chart also shows 26-Sep’s 6.65 Globex day-session low still intact as the larger-degree corrective low and key longer-term BULL risk parameter the market needs to fail below to break Jul-Oct’s uptrend and reinforce a broader peak/reversal count. In effect, 7.00 and 6.65 remain intact as the key directional flexion points after three weeks of lateral chop.


The daily log high-low chart above and close-only chart below show upside momentum that’s been dying on the vine for two months. Especially “up here” near the upper-quarter of this year’s range and against a massive peak/reversal-threat environment stemming from the extent and impulsiveness of May-Jul’s downtrend, this flagging momentum maintains a precarious position for bulls with questionable longer-term risk/reward metrics. We continue to advise a cautious interim bullish policy and exposure for longer-term commercial players due to the fact that the market has yet to break the uptrend from 22-Jul’s 5.62 low. But heading into Wed’s key crop report and with the market only spittin’ distance from either reaffirming a 4-month uptrend or reversing it, it won’t take much to expose a bigger move either way.
These daily charts show 26-Se’s 6.65 Globex day-session low and that day’s 6.66 corrective low close as the area this market needs to sustain gains above to maintain the 4-month uptrend. A failure below this area won’t necessarily negate a broader bullish count and confirm a major multi-quarter peak/reversal process. But given the backdrop of long-term momentum, sentiment and wave elements, such a failure would be hard to ignore as an event consistent with such a long-term bearish count. Per such, this 6.65/6.66-area remains a pivotal one around which longer-term commercial players remain advised to toggle directional biases and exposure.

The long-term factors on which our major peak/reversal count is predicated remain intact until and unless negated by a recovery above 16-May’s 7.66 high in the Dec contract:
- late-May’s bearish divergence in weekly momentum amidst
- historically extreme bullish sentiment
- a complete a massive 3-wave (B-Wave) rally from Jun’20’s 3.69 low to May’s 7.66 high and
- the extent and 5-wave impulsiveness of May-Jul’s initial counter-trend decline.
Against this backdrop, the “extensive”- in terms of both price and time- recovery from Jul’s 5.62 low was not unexpected and is a typical corrective rebuttal of an initial counter-trend decline WITHIN a major peak/reversal process. To defer or negate this bearish call, this market needs to not only breakout and sustain gains above 10-Oct’s 7.07 high, but also maintain that trendy rally through 16-May’s 7.66 high. A failure below the 6.66/6.65-area reinforce the peak/reversal count and expose what could morph into a protracted move south and eventual break below Jul’s low in whatever becomes the prompt contract for the 2022 crop.
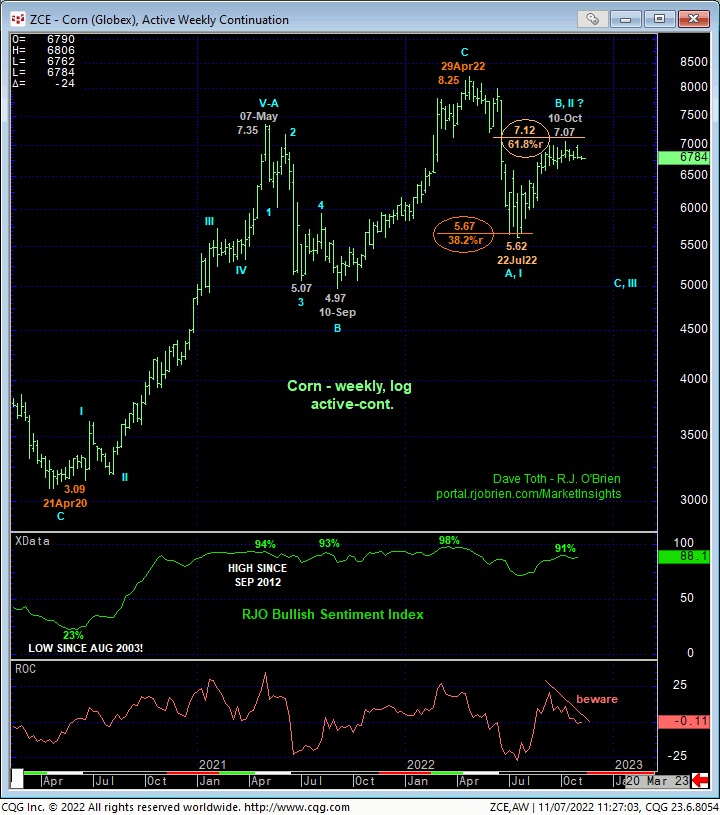
Per such a bearish count, it’s notable that the Managed Money community has again flocked to the bull side with an 88% reading in out RJO Bullish Sentiment Index reflecting 314K longs reportable to the CFTC versus only 42K shorts. Such a bullish skew means little as long as the uptrend is sustaining itself. A bearish divergence in weekly momentum below 6.66/6.65 however will, in fact, break this uptrend and render sentiment/contrary opinion an applicable technical tool warning of tremendous fuel for downside vulnerability.


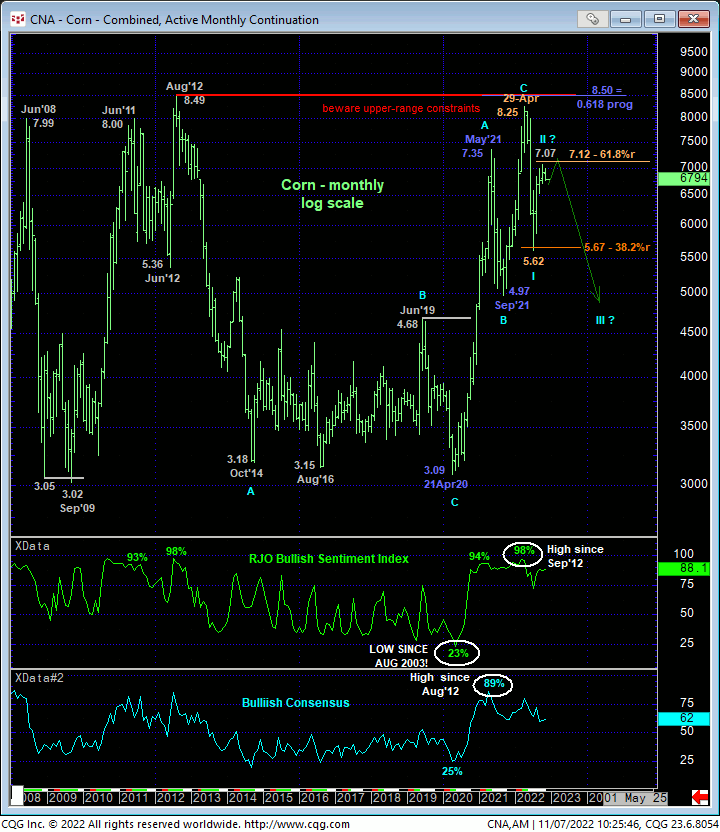
Finally, on a weekly (above) and monthly (below) log scale active-continuation basis, these charts show:
- the market’s total rejection of the extreme upper recesses of its historical range
- Apr-Jul’s swoon holding the (5.67) 38.2% retrace of 2020 – 2022’s entire 2020 – 2022 rally from 3.09 to 8.25 and
- the recovery from Jul’s 5.62 low thus far stalling at the (7.12) 61.8% retrace of Apr-Jul’s 8.25 – 5.62 decline.
Amidst upside momentum that’s been waning for two months and with the Managed Money community once again heavily skewed to the bull side, it’s not hard to question the risk/reward merits of a continued bullish policy and exposure up here around 6.80-to-7.05-area levels.
These issues considered, a bearish policy remains advised for short-term traders with a recovery above 7.00 required to negate this call and warrant its cover. A cautious bullish policy and exposure remain OK for longer-term commercial players with a failure below 6.65 required to warrant neutralizing any/all bullish exposure and moving to a cautious bearish policy with a subsequent recovery above 7.00 required to negate that call and warrant its cover. In effect, traders are advised to toggle directional biases and exposure around the 7.00 and 6.65 levels commensurate with their personal risk profiles. Below, we discuss bull and bear hedge strategies structured around this market’s well-defined and pivotal 6.65 – 7.00-range.

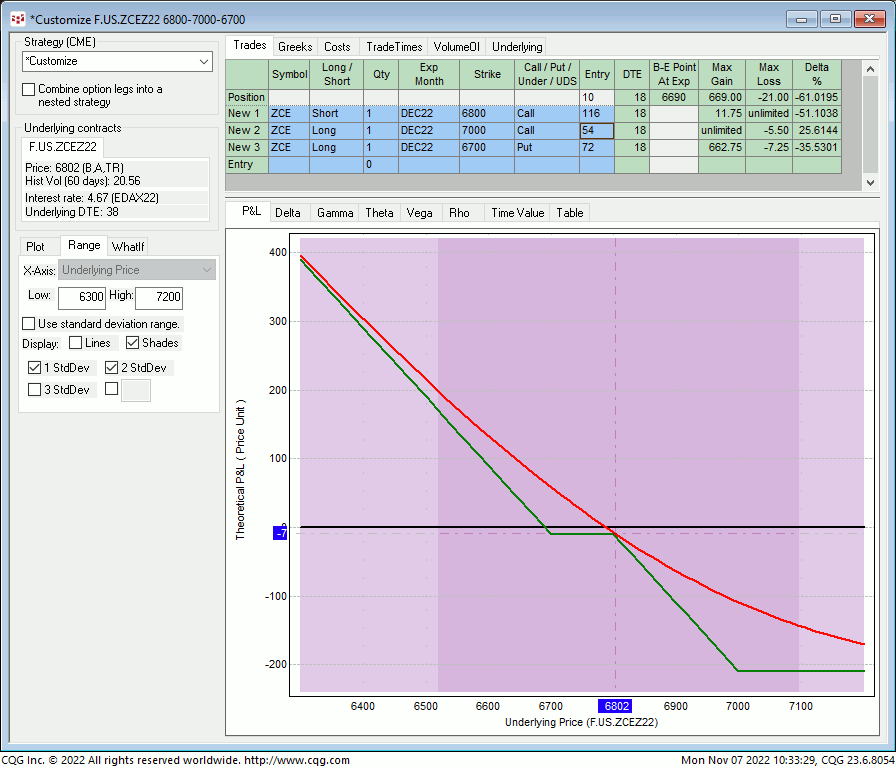
PRODUCER BEAR HEDGE: SHORT DEC 6.80 – 7.00 CALL SPREAD / LONG DEC 6.70 PUT COMBO
For producers needing/wanting to prepare for a bearish surprise resulting from Wed’s crop report, we recommend selling the Dec 6.80 – 7.00 Call Spread around 6-1/4-cents and buying the Dec 6.70 Puts around 7-1/4-cents for a net cost of a penny. This strategy provides:
- a current net delta of -61%
- favorable margins
- fixed cost/risk of 1-cent if the underlying Dec contract settles between 6.80 and 6.70 at expiration 18 days from now on 25-Nov
- fixed, maximum risk/cost of 21-cents on ANY rally above 7.00
- virtually unlimited, dollar-for-dollar downside hedge protection below its 6.69 breakeven at expiration.

END-USER BULL HEDGE: SHORT DEC 6.80 – 6.60 PUT SPREAD / LONG DEC 6.90 CALL COMBO
This strategy is basically the inverse of the produce bear hedge above, with end-users selling the Dec 6.80 – 6.60 Put Spread for around 7-3/8-cents and buying the Dec 6.90 Calls around 7-7/8-cents for a net initial cost of about a 1/2-cent. This strategy provides:
- a current net delta of +62%
- favorable margins
- risk/cost of 1/2-cent if the underlying dec contract settles between 6.80 and 6.90 at expiration 18 days from now on 25-Nov
- fixed, maximum risk/cost of 20-1/2-cents on ANY downside collapse below 6.60
- unlimited, dollar-for-dollar upside hedge protection above 6.90.
Please contact your RJO representative for updated bid/offer quotes on these strategies and good luck on Wed’s numbers.


