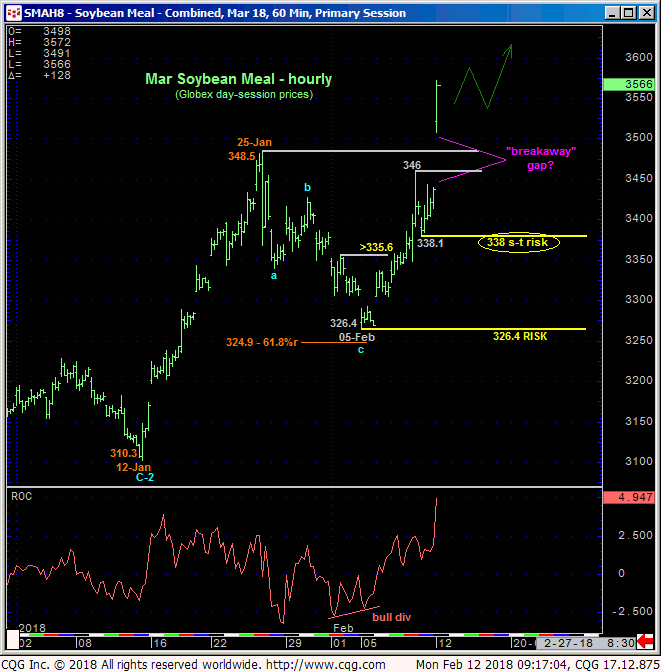
This morning’s bust-out above not only 25-Jan’s 348.5 high but also the past YEAR’S resistance confirms our bullish count most recently discussed in Thur’s Technical Blog and leaves smaller- and larger-degree corrective lows in its wake at 338.1 and 326.4 that now serve as our new short- and longer-term risk parameters to a still-advised bullish policy and exposure. Former 348-to-345-area resistance is considered new near-term support ahead of further and possibly extensive gains.
Another obvious feature in the hourly chart below is the gap left open by today’s higher open. Many traders might be thinking that “all gaps are closed” and that this rally is at least a temporary fade ahead of a relapse top Fri’s 343.8 close. This could be a grave mistake given this misnomer surrounding “gaps”.
There are three types of gaps: common, break-away and exhaustion gaps. Common gaps are, well, most common and occur frequently within rangey environments. Common gaps are typically closed, NOT because “all gaps are closed”, but rather and simply because the market would have traded to this area anyway within the context of the range-trade in general. Exhaustion gaps characterize an emotional, “exhaustive” END to a move and is quickly followed by a reversal that closes the gap.
Breakaway gaps typically occur in the middle, accelerating stages of a major trend. These gaps are typically left opened until the major trend ends, which could be weeks, months or even years later. Given today’s breakout above the past YEAR’S major resistance, today’s gap may be such a breakaway gap that warns of further and possibly steep, even relentless gains straight away.
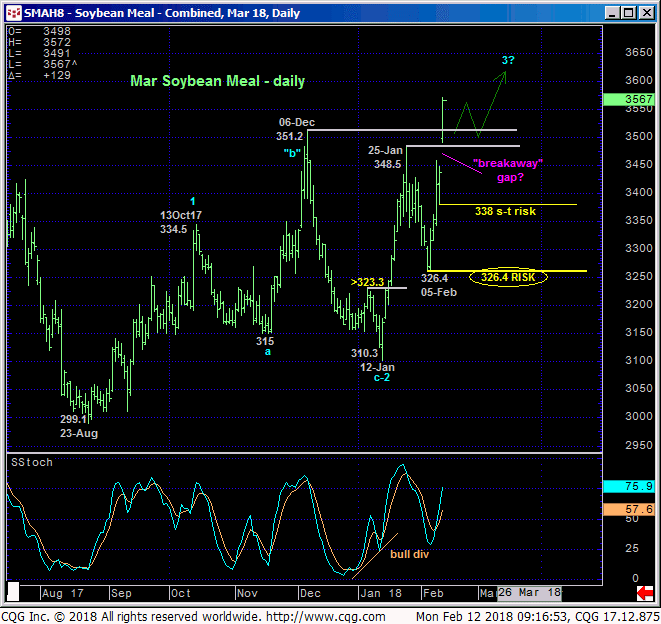
Today’s break above the past couple months’ 348-to-351-area resistance confirms not only late-Jan/early-Feb’s sell-off attempt as a correction, but also Oct-Jan’s preceding and much larger-degree chop as a correction consistent with our preferred bullish count. Combined with the Mar contract’s obliteration of the past YEAR-AND-A-HALF’S resistance on a weekly close-only basis below, this market can now look back on TWO YEARS of base-building behavior that may now have finally come home to roost with a dramatic C- or 3rd-Wave rally. Basis the Mar contract former 340-to-335-range resistance would be fully expected to hold as new support ahead of further and possibly long-term gains.
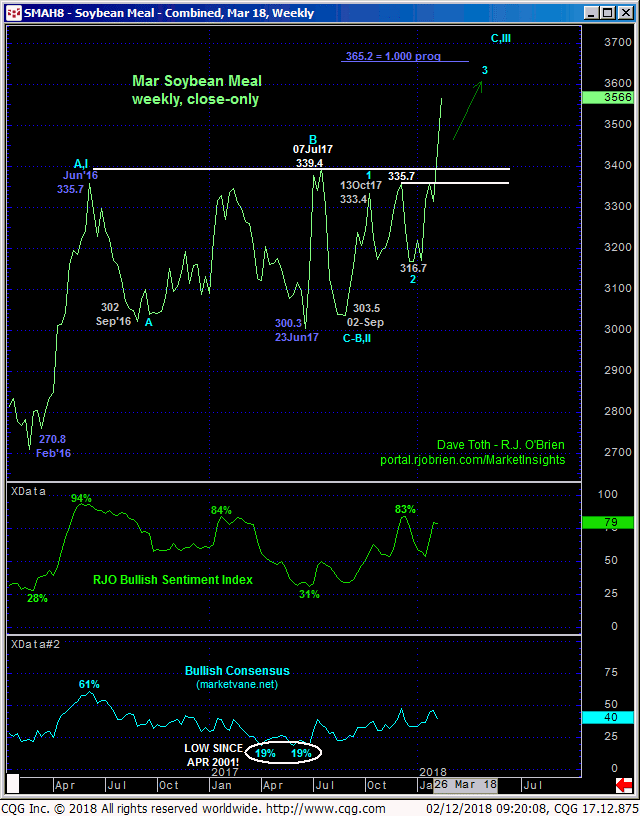
On an active-continuation chart basis below, we have recently discussed the pivotal nature of the 348-to-354-area that has capped this market as resistance for the past year, the break above which exposes an area totally devoid of any technical levels of merit shy of Jun’16’s 432 high. This doesn’t mean we’re forecasting a move to 432, but it certainly does mean that until and unless this market stems the clear and present and potentially major uptrend with a confirmed bearish divergence in momentum, ANY amount of upside is in play, including a run to or even through 432.
In effect, there is no resistance currently. EVERY pertinent technical level currently exists ONLY BELOW the market in the form of former resistance-turned-support like the 350-to-345-area and prior corrective lows like 338 and 326.
The only levels that exist above the market shy of Jun’16’s 432 high are “derived” from other price points. So-called technical levels like Bollinger Bands, Imokus, channel lines, the ever-useless moving averages and even the vaunted Fib progression levels we cite often never have proven to be reliable reasons to buck a trend without an accompanying momentum failure, and they NEVER WILL.
By taking out the past year’s resistance the major trend is up. This is a technical fact that requires weakness below at least 338 and preferably 326 to mitigate. And in lieu of such weakness further and possibly extensive gains straight away should not surprise.
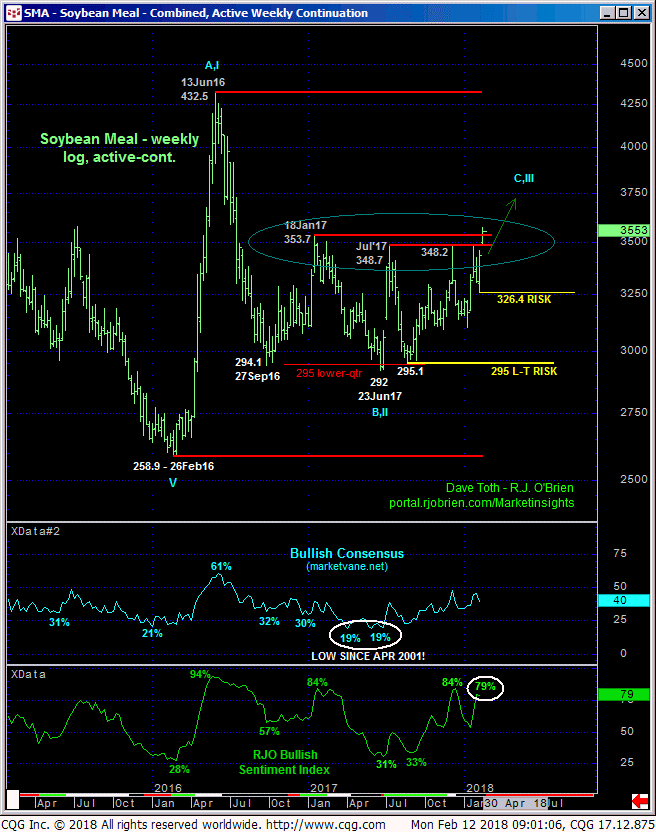
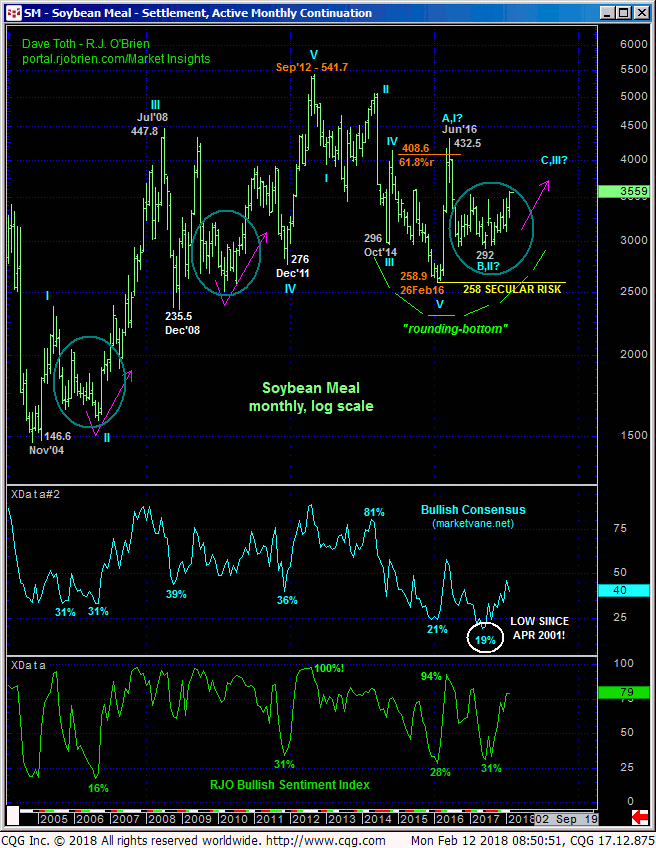
Finally, traders are reminded of our very long-term count that contends that Feb’16’s 258.9 low COMPLETED the secular bear trend from 2012’s 541 all-time high and that the relapse attempt from Jun’16’s 432 high to Jun’17’s 292 low was the (B- or 2nd-Wave) correction within a major, multi-year “rounding-bottom” reversal pattern that will ultimately produce gains above Jun’16’s 432 high. This major base/reversal process is virtually identical to those that followed Dec’08’s 2325 low and Nov’04’s 146 low circled in blue below.
These issues considered, a full and aggressive bullish policy is advised with weakness below at least 338 and preferably 326 required to threaten and negate this count. In lieu of such weakness further and possibly accelerated gains are expected straight away with former 353-to-345-range resistance considered new near-term and key support.
