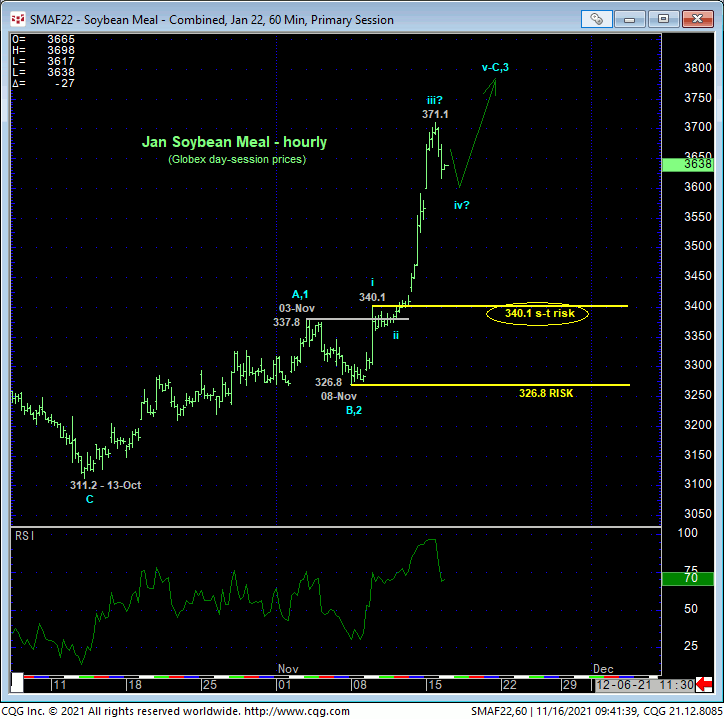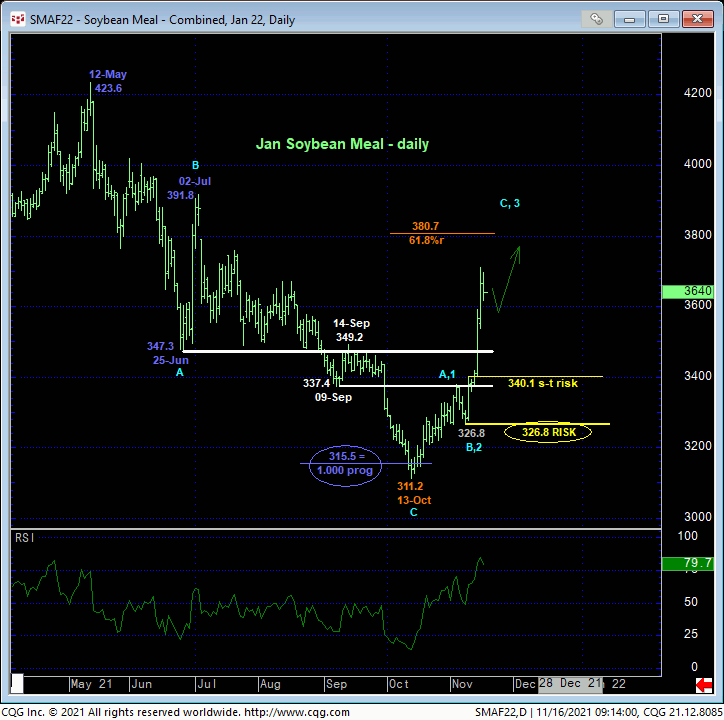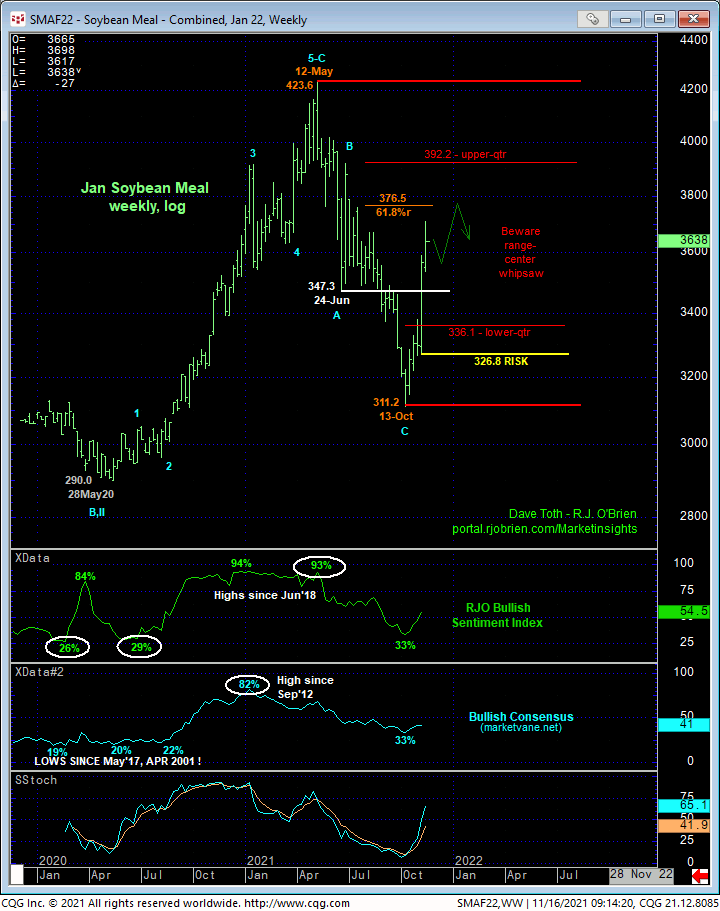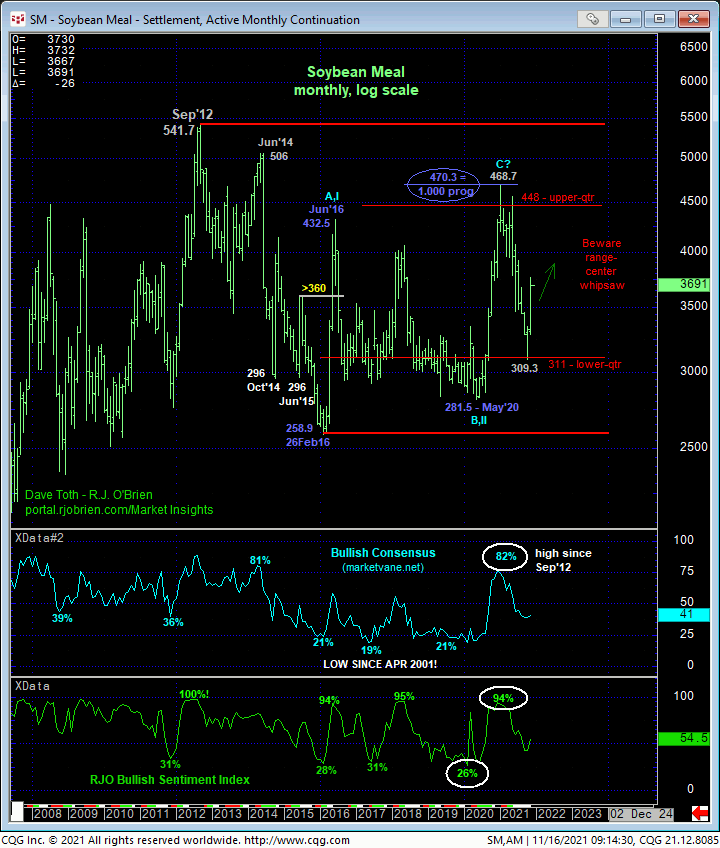

Fri and yesterday’s sharp, accelerated continuation of the prior three weeks’ rally confirms our base/reversal-threat count introduced in 26-Oct’s Technical Blog. But now that the market has quickly returned to deep within the middle-half bowels of its historical lateral range we’ll discuss more below, tactical emphasis shifts to a more conservative approach to risk assumption due to what are likely higher odds of aimless whipsaw risk.
As a result of the extent and impulsive nature of the past week’s rally, the hourly chart above and daily chart below show the market’s definition of 08-Nov’s 326.8 low in the now-prompt Jan contract as the latest larger-degree corrective low. This is the level the market needs to fail below to render the broader recovery attempt from 13-Oct’s 311.2 low a 3-wave and thus corrective affair that would then re-expose this year’s major downtrend.
This said, making non-bullish decisions “down there” is quite impractical, so emphasis shifts to a more conservative approach to risk assumption and trying to identify a tighter but still objective level from which to rebase and manage the risk of an interim bullish policy and exposure. Unfortunately, the extent and uninterrupted 3rd-Wave nature of the past couple days’ explosive rally leaves nothing in the way of either a corrective low or former resistance-turned-support shy of 09-Nov’s 340.1 (minor 1st-Wave) high the market now needs to fail below to threaten a continued bullish count. Per such and for the time being, we’re defining that 340.1 high as our new short-term risk parameter from which non-bearish decisions like short-covers and bullish punts can be objectively rebased and managed.
Fortunately, we think, the 3rd-wave-manner in which the past few days’ rally continued likely means a slowdown process before this rally may be vulnerable to ending and reversing. Such a process is likely to include an interim (suspected minor 4th-Wave) setback- perhaps like the past few hours- before a (prospective 5th-Wave) resumption of this rally to at least one more round of highs above yesterday’s 371.1 high. And the moment such a 371.1+ new high is achieved is the moment that our shorter-term risk parameter can be objectively trailed from 340.1 to a tick below the low of this corrective setback.


On a daily and even weekly (above) basis, the past month’s recovery is not unimpressive. AT LEAST the intermediate-term trend is clearly up and should not surprise by its continuance or acceleration. But for a bullish policy and exposure to continue to be preferred, it’s imperative that the bull continued to BEHAVE LIKE ONE by sustaining trendy, impulsive behavior higher. A bearish divergence in short-term momentum will not necessarily negate a longer-term bullish count. But stemming from the middle-half bowels of both this year’s range and a historical range that dates from 2008 where the odds of aimless whipsaw risk are approached as higher, even a shorter-term mo failure will at least stem the bull and, at most, commence a period of aimless chop that would question the risk/reward merits of directional exposure either way. Herein lies the importance of identifying a tighter but objective bull risk parameter in the days/week ahead.
Indeed, only a quick glance at the monthly log chart below is needed to see how erratic and volatile this market has been between roughly 310 and 445 over the past SEVEN YEARS beginning in Oct 2014. Even a short-term momentum failure cannot be ignored as a threat that this market might have completed another such volatile, intra-range spike ahead of resumed/further lateral-to-LOWER prices thereafter. Until and unless such a mo failure arrests the clear and present uptrend, there’s no way to know it’s upside potential.
These issues considered, a bullish policy and exposure remain advised with a failure below 340 required to threaten this call enough to warrant moving to a neutral/sideline position. This said, we will be keeping a close eye on short-term price action and, we believe, at least one more round of highs above 371.1 in the days/week ahead to trail this short-term but important bull risk parameter to a much closer, more conservative level.


