Posted on Oct 10, 2023, 10:04 by Dave Toth
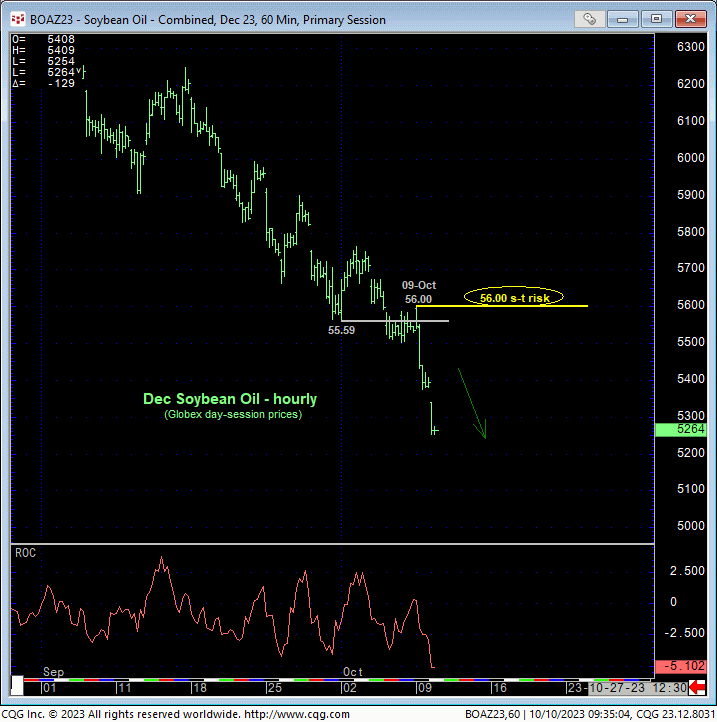
Yesterday and today’s continued, accelerated decline reaffirms our major peak/reversal count reintroduced in 07-Sep’s Technical Webcast and leaves yesterday’s 56.00 Globex day-session high in its wake as the latest smaller-degree corrective high this market is now minimally required to recoup to even defer, let alone threaten a broader bearish count. Per such, we’re identifying this 56.00 level as our new short-term parameter from which shorter0-term traders can objectively rebase and manage the risk of a still-advised bearish policy and exposure.
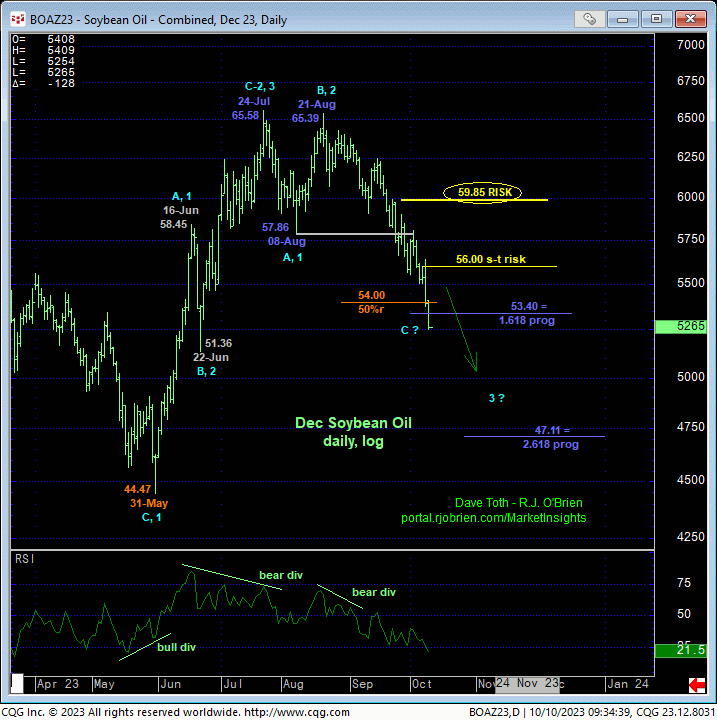
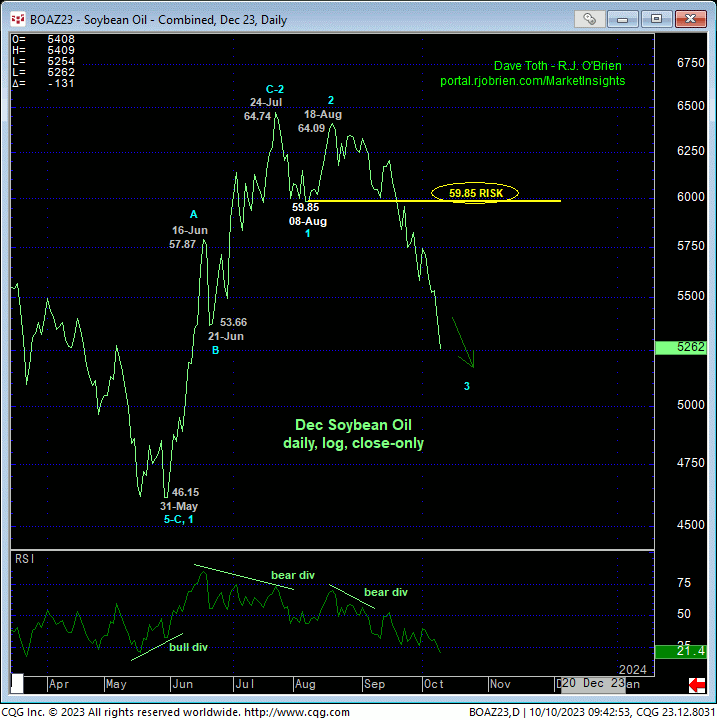
Moving out to a longer-term perspective, the daily log chart above and close-only chart below show the deeper, accelerating plunge from 21-Aug’s 65.39 high. We have recently noted the (54.00) 50% retrace of May-Jul’s 44.47 – 65.58 rally that the market has just blown through. We know for a fact that the decline from 21-Aug’s 65.39 high can be one of only two things: the C-wave a correction or the 3rd-wave of a major reversal.
There comes a time when we have to migrate away from the “retracing” of a move that may be considered a correction and TO the “progression” of a move that’s a reversal lower. And that time is now as a result of the past couple days’ accelerated plunge. Instead of biasing towards a corrective retracement that may hold, focus now is on the 1.618 and 2.618 progressions of Jul-Aug’s initial 1st-Wave decline from 65.58 to 57.87 taken from 21-Aug’s 2nd-Wave high at 65.39. These progressions cut across at 53.40 (a level the market just broke today) and 47.11.
Long-time readers of our Technical Blog know of our disdain for merely “derived” so-called “technical levels” like Bollinger Bands, trend lines, the ever-totally-useless moving averages and even the vaunted Fibonacci relationships we cite often in our analysis. NOT ONE of ANY of such derived levels should ever be considered a support or resistance level in the absence of an accompanying confirmed momentum divergence needed to break the trend at hand. Indeed, neither the 50% retrace or 1.618 progression cited above held worth a spit. We use these Fib relationships to provide some guidance as to what wave might be unfolding at the time and to identify an “area of interest” around which to be on the keener lookout for a trend-deferring or threatening momentum failure.
In this case, since the market has accelerated through the 50% retrace of May-Jul’s rally and the 1.618 progression of Jul-Aug’s initial counter-trend break, odds have increased that the decline from 21-Aug’s 65.39 high is the dramatic 3rd-Wave of an eventual 5-wave sequence down that could test or even break May’s 44.47 high. Combined with a new short-term but objective bear risk parameter at 56.00, the risk/reward metrics of a continued bearish policy have been reinforced. To negate this major bearish count, a recovery above 08-Aug’s (suspected 1st-Wave) low close at 59.85 remains required, so hence this level as our key long-term bear risk parameter pertinent to commercial players.
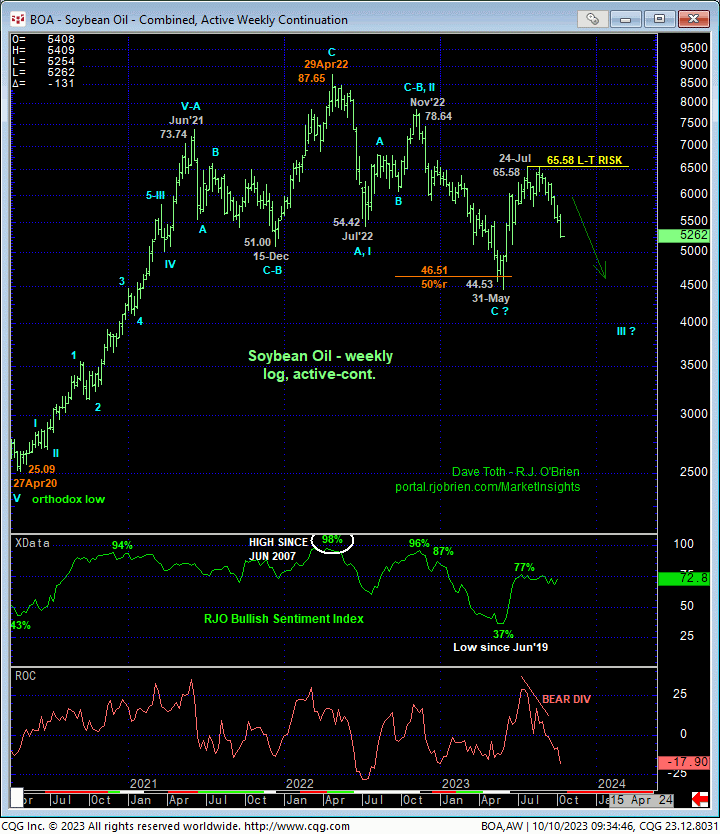
On an even broader scale, the weekly log active-continuation chart above shows this market coming off the compelling combination of a bearish divergence in weekly momentum amidst historically frothy levels in our RJO Bullish Sentiment Index of the hot Managed Money positions reportable to the CFTC. This extent to which this community has its neck skewed to the bull side has been and remains fuel for downside vulnerability as the overall market forces the capitulation of this long-&-wrong exposure.
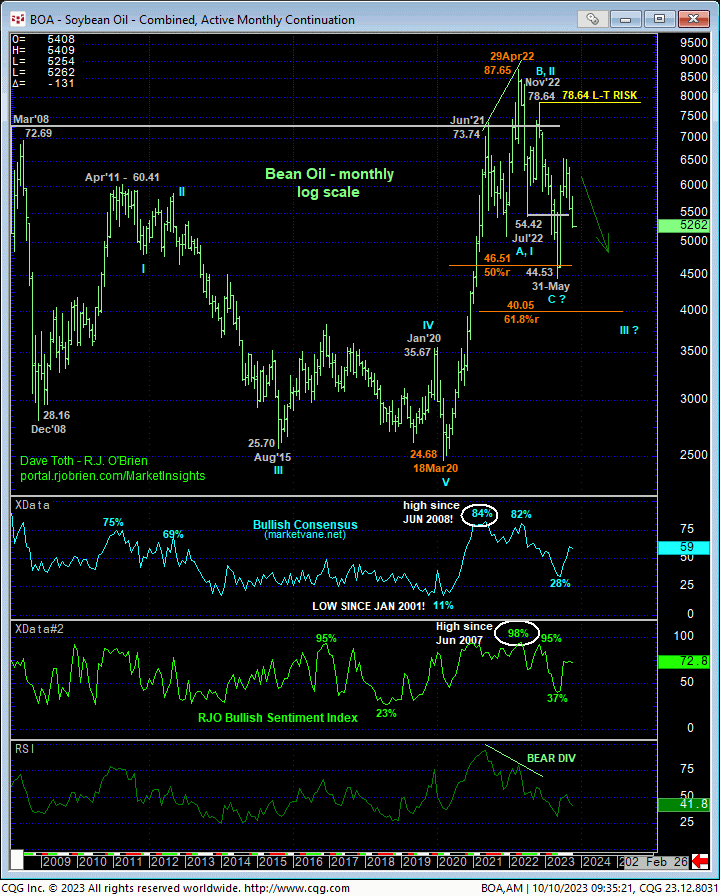
These weekly elements are subsets of an even broader, multi-quarter peak/reversal process from Apr’22’s 87.65 high shown in the monthly log chart below. Until and unless the Dec contract can recoup even our relatively tight bear risk parameters at 56.00 and 59.85, the continuation of the new secular bear market from last year’s all-time high remains intact with downside potential below at least May’s 44.53 low that, at that point, would expose a run at the lower-quarter of this market’s historical range.
In sum, a full and aggressive bearish policy and exposure remain advised with a recovery above at least 56.00 required to even defer, let alone threaten this call and warrant defensive measures. In lieu of such strength, further and possibly accelerated losses remain expected.
