Posted on Aug 08, 2022, 09:49 by Dave Toth
DEC SOYBEAN OIL
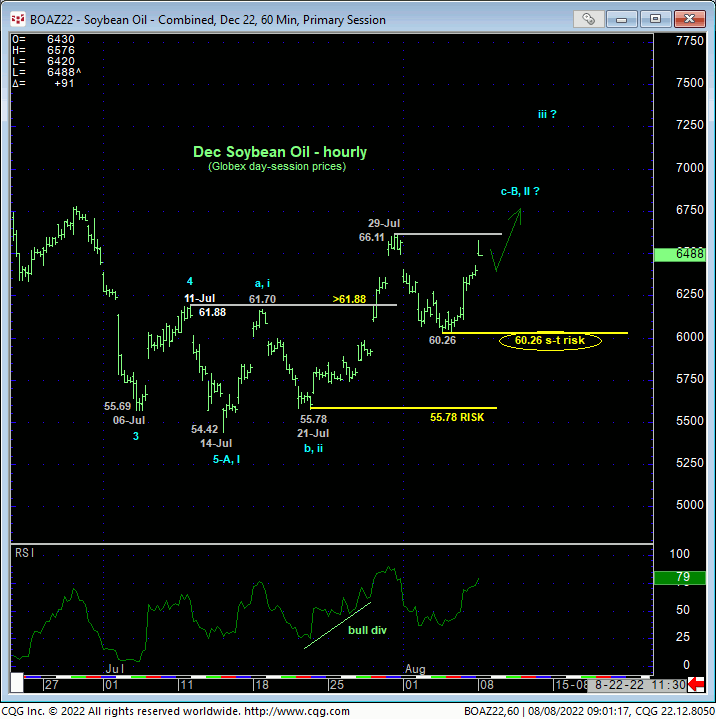
While the hourly chart below shows that the market has yet to break 29-Jul’s 66.11 high, the market has recovered enough over the past couple days’ to reinforce of interim base/correction count discussed in 28-Jul’s Technical Webcast and, most importantly, identify 03-Aug’s 60.26 low as the end or lower boundary of the latest smaller-degree corrective setback this market is expected to sustain gains above to maintain a more immediate, if corrective bullish count. Per such, we’re defining 60.26 as our new short-term parameter from which shorter-term traders with tighter risk profiles can objectively rebase and manage the risk of non-bearish decisions like short-covers and cautious bullish punts.
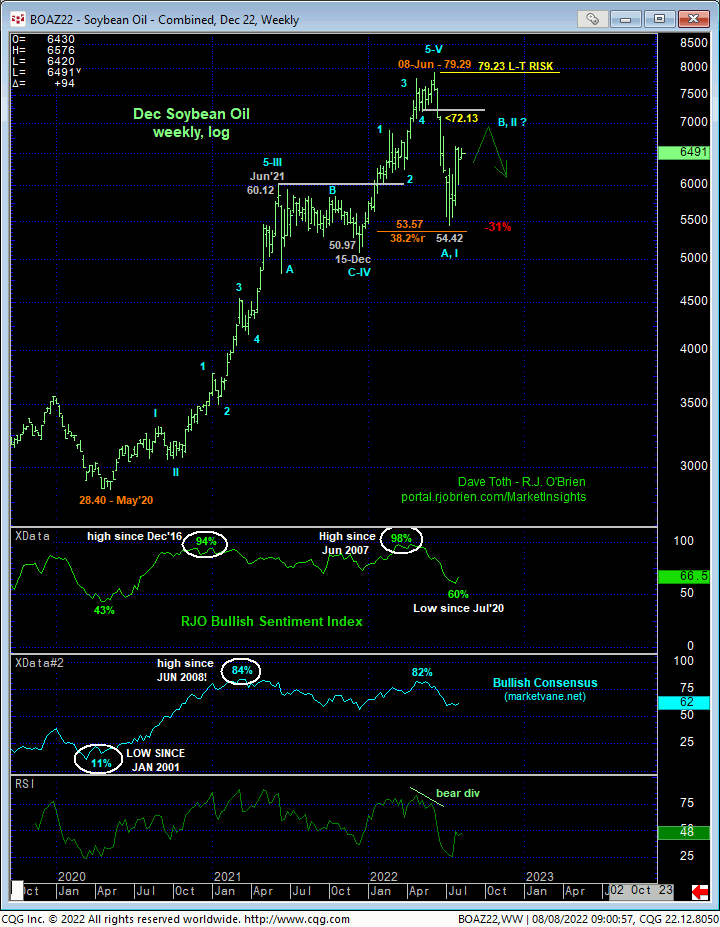
From a longer-term perspective, we’ve discussed the unique and compelling list
of major peak/reversal factors:
- 17-Jun’s bearish divergence in WEEKLY momentum amidst
- what was then historically frothy sentiment/contrary opinion levels
- a completed 5-wave Elliott sequence up from at least Dec’21’s 50.97 low and prospectively a massive sequence from May’20’s 28.40 low and
- proof of an impulsive 5-wave decline from 08-Jun’s 79.29 high to 14-Jul’s 54.42 low that, theoretically at least, is only the initial A- or 1st-Wave decline of a major correction or reversal lower.
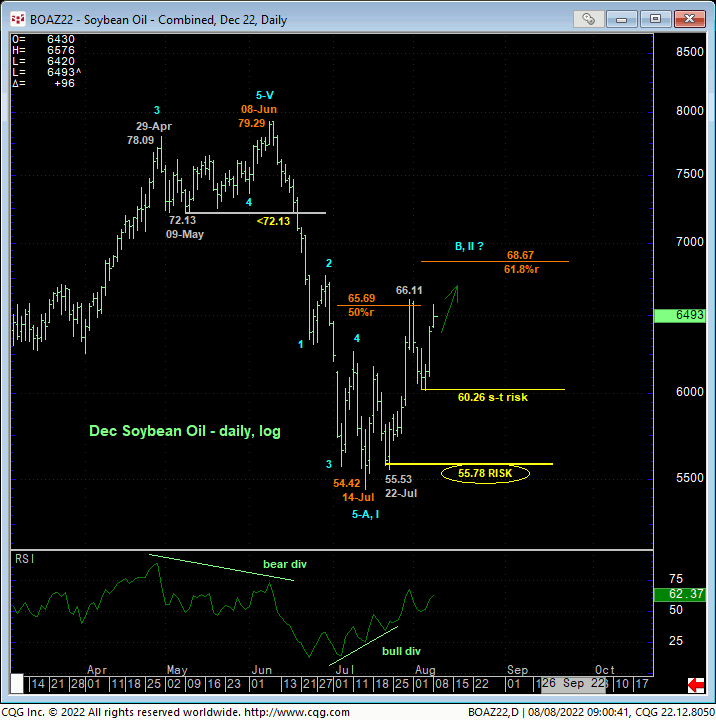
Against this backdrop of technical facts, the recovery from 14-Jul’s 54.42 low is a suspected B- or 2nd-Wave CORRECTION ahead of an eventual C- or 3rd-Wave down to levels well below 54.42. Per this count, it’s incumbent on us to be watchful for a recovery-stemming bearish divergence in momentum that could complete this correction and re-expose the new major bear trend.
The daily log chart above shows that this market has already retraced 50% of Jun-Jul’s 79.29 – 54.42 decline, but no bearish divergence in momentum has been confirmed to render this merely derived technical level relevant. But a failure below 60.26 would, rejecting/defining a high from which non-bullish decisions could then be objectively based and managed.
With respect to the extent of any remaining corrective recovery, it may prove important to note that our sentiment/contrary opinion indicators have both dropped relatively sharply over the past couple months that might allow for a ore “extensive” corrective whipsaw higher.
These issues considered, the intermediate-term trend remains clearly up in what we believe is a corrective recovery within a major peak/reversal process. Further gains remain anticipated with a failure below 60.26 required to threaten this call enough to warrant moving back to at least a neutral/sideline position if not a cautiously bearish stance. In effect, traders are advised to toggle directional biases and exposure around 60.26.
DEC SOYBEAN MEAL
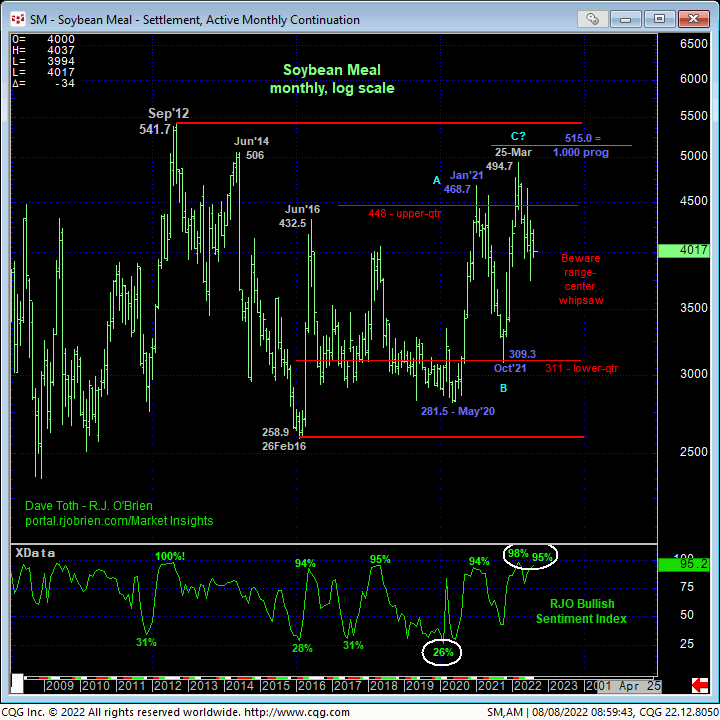
Over the past week-and-a-half, we’ve warned about this market’s precarious condition after spiking to the upper-quarter of this year’s range and then failing to sustain those gains. Additionally and as we’ll discuss below, our RJO Bullish Sentiment Index has continued to increase to a 95% level, reflecting a whopping 84K Managed Money long positions to just 4K shorts. We believe this combination of factors warns of downside vulnerability that could be major in scope.
Starting from a short-term basis, the hourly chart below shows this market’s gross failure to sustain late-Jul’s bust-out above not only the prior month’s 418-to-408-area resistance that then SHOULD HAVE held as support, but also above all of the key resistant highs of the past QUARTER. After 01-Aug’s bearish divergence in short-term momentum AND last Thur’s sharp recovery attempt that was also repelled, we believe this price action is indicative of a broader peak/reversal environment. The important by-products of this price action are the markets definition of rejected highs at 422.6 and 431.7 that now serve as our new short- and longer-term risk parameters from which a cautious bearish policy and exposure can and should be objectively based and managed.
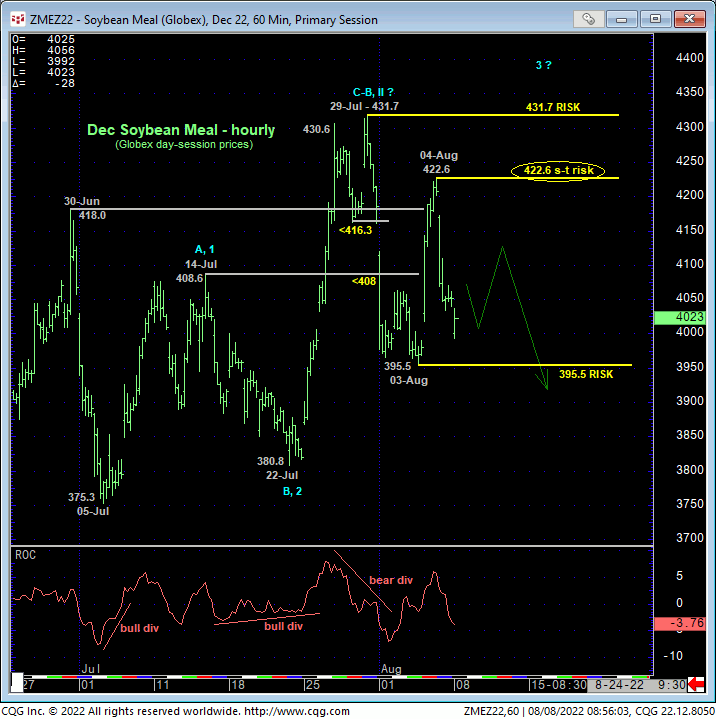
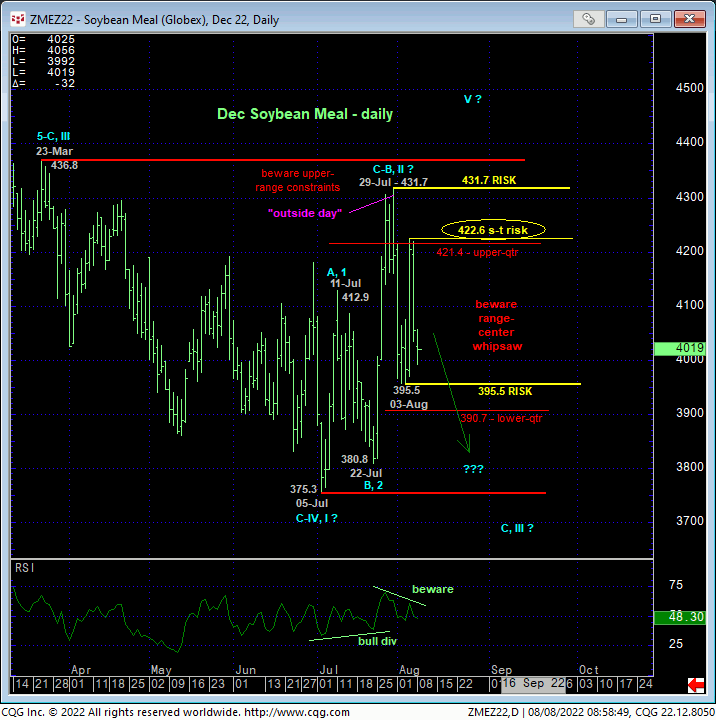
If there’s a challenge to this market, it’s its position back deep within the middle-half bowels of this year’s range where the risk/reward merits of initiating directional exposure are poor. Per such, any directional punt, either way, is advised to be approached very cautiously and conservatively.
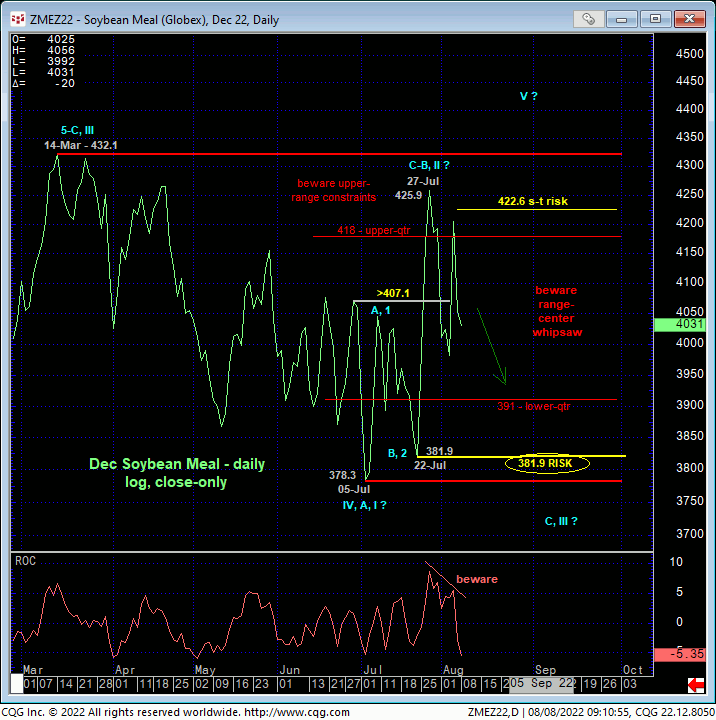
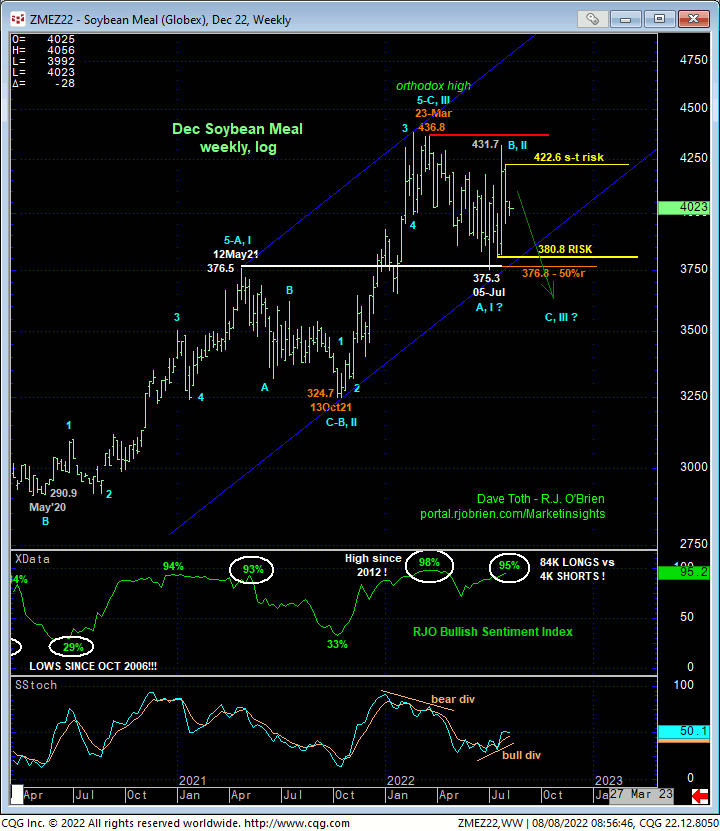
The key reason we’re again biasing to the bear side, in addition to early-Aug’s gross failure to sustain late-Jul’s rally attempt, is the continued RISE in our RJO Bullish Sentiment Index to a 95% reading that has warned of and accompanied major peak/correction/reversal environments in the past. Further weakness below 03-Aug’s 395.5 will confirm a bearish divergence in DAILY momentum that, given the extent to which the Managed Money community has its neck sticking out on the bull side, could produce steep, protracted losses thereafter as the overall market forces the capitulation of this egregious exposure.
These issues considered, traders are advised to move to a cautious bearish stance on the immediate break below 395.5 with a recovery above 422.6 required to negate this specific call and warrant its cover. We will also be on the watch for another bearish divergence in short-term mo following another intra-range corrective pop that would present a preferred risk/reward selling opportunity. In 03-Aug’s Technical Blog we discussed such a tack on a rebound to the 415-to-420-area, but Thur’s spike to 422.6 and sharp relapse Fri was too violent to produce such a divergence. As the market’s still in the middle-range bowels however, such another pop may still be in the cards to the 410-to-415-area however.
