Posted on Aug 07, 2023, 08:24 by Dave Toth
NOV SOYBEANS
Although the hourly chart f Globex day-session prices below does not yet reflect it, overnight prices show the market breaking and trading below last week’s 13.15 low, reaffirming our bearish count introduced in 31-Jul’s Technical Blog. This continued weakness leaves Fri’s 13.44 high in its wake as the latest smaller-degree corrective high this market is now minimally required to recoup to confirm a bullish divergence in short-term momentum, arrest the current slide and expose what we’d then believe is only a corrective rebuttal to what looks to be an impulsive decline from 24-Jul’s 14.35 high that is consistent with a broader bearish count. Per such, we’re defining 13.44 as our new short-term bear risk parameter to which shorter-term traders with tighter risk profiles can objectively rebase and manage the risk of a bearish policy and exposure.


Today’s continued weakness comes on the heels of a compelling collection of elements that warns of a more protracted reversal lower:
- 31-Jul’s bearish divergence in daily momentum that breaks May-Jul’s uptrend that stems from
- the extreme upper recesses of the Nov contract’s 15-MONTH range amidst
- the return to historically frothy sentiment/contrary opinion levels as evidence by our RJO Bullish Sentiment Index below.
Indeed, the current 85% reading in our RJO BSI reflects a whopping 146K Managed Money long positions reportable to the CFTC versus only 26K shorts. Now that May-Jul’s uptrend has been broken, such an extent to which this community has its collective neck sticking out on the bull side may become fuel for downside vulnerability as the overall market forces the capitulation of this long-&-wrong exposure. On this broader scale, clearly, 24-Jul’s 14.35 stands out as THE high and long-term risk parameter this market has to recoup to mitigate our bearish count that still warns of a multi-quarter peak/reversal process from 2022’s 17.84 high and a new secular bear market.

The monthly log active-continuation chart below shows the massive peak/reversal process that dates from May’21’s 16.68 high and maintains Jun’22’s 17.84 high as the end of a massive 3-YEAR, textbook 5-wave sequence up from May’19’s 7.91 low. This topping process is virtually identical to that that unfolded from Aug’11’s 14.65 high and defined Sep’12’s 17.89 high as the end of the secular bull trend and start of a new multi-year secular bear market.
These issues considered, a bearish policy and exposure remain advised with a recovery above 13.44 required for shorter-term traders to move to the sidelines and commensurately larger-degree strength above 14.35 for longer-term commercial players to follow suit. In lieu of such strength, further lateral-to-lower, and possibly much lower prices remain anticipated.

DEC SOYBEAN MEAL
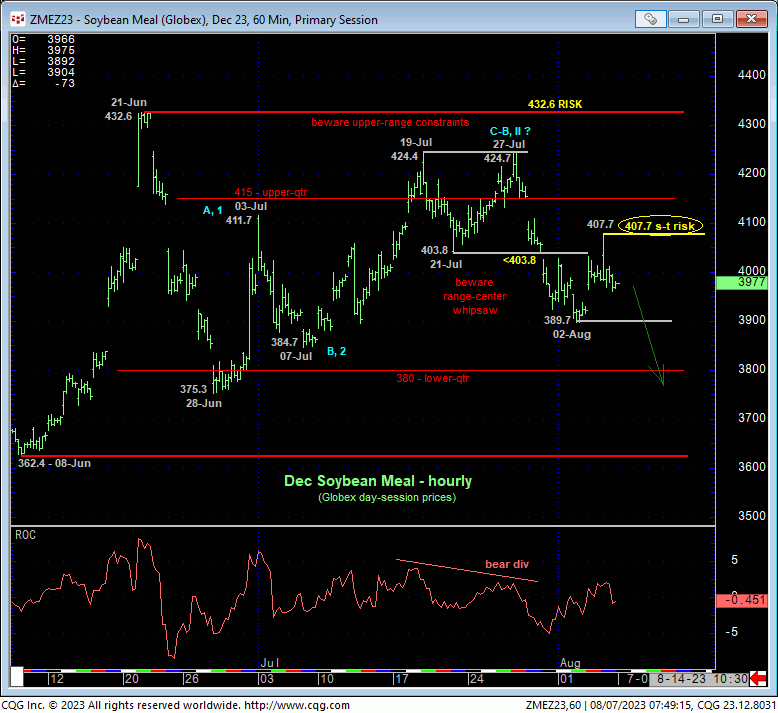
Here too, while the hourly chart of Globex day-session prices below does not yet reflect it, by breaking last week’s 389.7 low overnight, the Dec meal market has reaffirmed and reinstated at least the intermediate-term downtrend and our bearish count and left Fri’s 407.7 high in its wake as the latest smaller-degree corrective high this market is now minimally required to recoup to defer or threaten a bearish count. Per such, this 407.7 level is considered our new short-term parameter from which the risk of a bearish policy and exposure can be objectively rebased and managed by shorter-term traders.


On a broader scale, the daily log chart (above) only shows the market’s return to the middle-half bowels of this year’s range where we want to acknowledge the greater odds of aimless whipsaw risk. Herein lies the importance of tightening short-term bear risk to Fri’s 407.7 high, especially for shorter-term traders. But against the broader peak/reversal backdrop and after an exact 61.8% retrace of Mar-Jun’s 435 – 366 decline on a weekly log close-only chart below, we also must acknowledge the prospect that Jun-Jul’s recovery attempt is a major correction within a major downtrend ahead of a resumption of that broader bear trend below May/Jun’s 361-to-366-area lows.
Reinforcing this bearish count is the return to a bullishly skewed 83% reading in our RJO Bullish Sentiment Index, representing 90K Managed Money long exposure to just 19.5K shorts. Now that at least the intermediate-term trend is down, negatively effecting this community, the prospect of Managed Mony bulls coughing up this long-&-wrong exposure could provide fuel for downside vulnerability.

Finally and on an even longer-term basis, the monthly log active-continuation chart below shows the market’s total rejection of the upper-quarter of its historical range. Combined with understandable but typical extremes in bullish sentiment at pivotal long-term turns in a market, we believe the same type of multi-quarter peak/reversal process is underway as that that warned of and accompanied 2012’s all-time high.
These issues considered, a bearish policy remains advised with a recovery above 407.7 required for shorter-term traders to neutralize exposure and for longer-term commercial players to pare exposure to more conservative levels. In lieu of strength above at least 407.7, further lateral-to-lower, and possibly much lower levels remain expected.


