Posted on Dec 08, 2022, 12:01 by Dave Toth
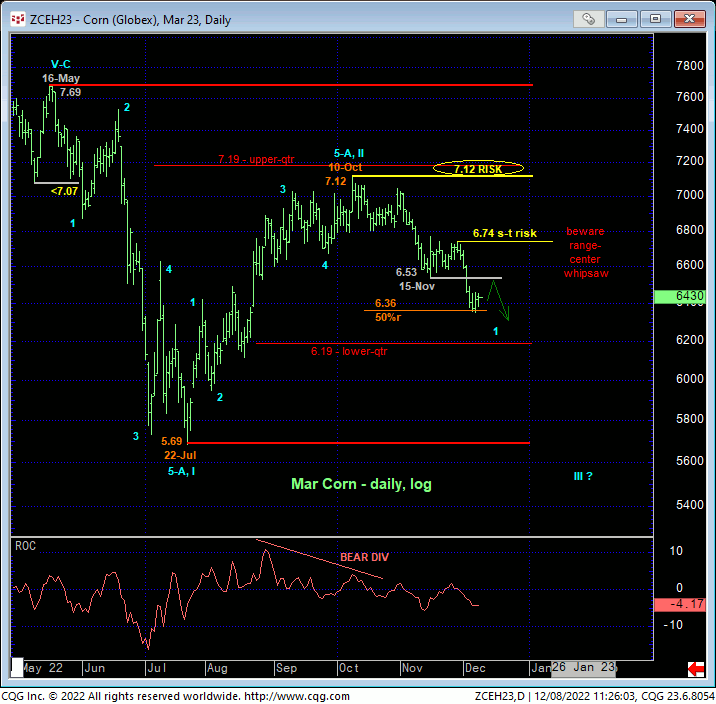
Last Fri and this week’s continued decline and clear break below 15-Nov’s 6.53 low reaffirms our broader peak/reversal count updated most recently in 02-Dec’s Technical Blog and warns of further and possibly protracted losses ahead. The hourly chart shows that as a direct result of late-Nov/early-Dec’s resumed decline, the market has identified 29-Nov’s 6.74 high as the latest smaller-degree corrective high this market is now minimally required to recoup to break the nearly-two-month developing downtrend and expose a correction of Oct-Dec’s decline from 7.12 or expose something bigger to the bull side. Standing between spot and 6.74 is a 6.53-to-6.58-area as now-former support that is considered new near-term resistance within a broader bearish count. per such, that 6.74 level remains intact as our short-term but key risk parameter the market needs to recoup to defer or threaten a more immediate bearish count pertinent to shorter-term traders.


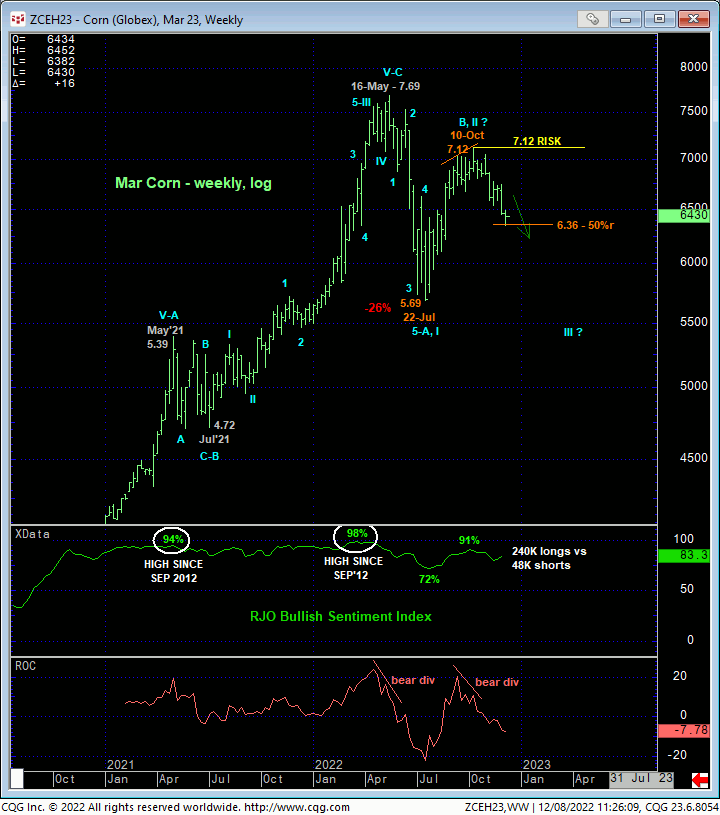
On a broader scale, both the daily (above) and weekly (below) log scale chart of the Mar contract show the market’s current position not only deep within the middle-half bowels of this year’s range where the odds of aimless whipsaw risk are approached as higher, but also holding thus far at the exact (6.36) 50% retrace of Jul-Oct’s 5.69 – 7.12 rally. IF IF IF the past two months’ decline is “just” a correction of Jul-Oct’s rally within something broader to the bull side, the market holding such a retracement would be an interesting development.
Long-term readers of our analysis know however of our disdain for merely derived so-called technical levels like trend lines, various “bands”, imokus, the ever0-useless moving averages and even the vaunted Fibonacci relationships we cite often in our analysis. Indeed, in and of themselves, these levels are useless, even harmful, without an accompanying confirmed bullish (in this case) divergence in momentum needed to arrest the clear and present downtrend. Herein lies the importance of 29-Nov’s 6.74 corrective high and short-term bear risk parameter. If/when the market recoups levels above 6.74, at least an interim and possibly longer-term bullish case can be more objectively made. Until and unless such 6.74+ strength is proven, the simple fact of the technical matter is that at least the intermediate-term trend is down and should not surprise buy its continuance or acceleration straight away.
Additionally, the current 2-momnth downtrend is a subset of what is still arguably a massive peak/reversal process from May’s 7.69 high that, if correct, warns of a major C- or 3rd-Wave resumption of May-Jul’s initial counter-trend decline to eventual new lows below 5.69. The sentiment/contrary opinion fact that the Managed Money community still has its collective neck skewed tremendously to the bull side as indicated by a still-frothy 83% reading in our RJO Bullish Sentiment Index reinforces this major peak/reversal threat.
These issues considered, a bearish policy and exposure remain advised with a recovery above 6.74 required for shorter-term traders to neutralize exposure and for even longer-term commercial players to pare exposure to more conservative levels. In lieu of such strength, further and possibly accelerated losses remain expected. Against this backdrop and given resistance from the 6.55-to-6.75-range, we discuss the structure of a bear hedge option strategy below.

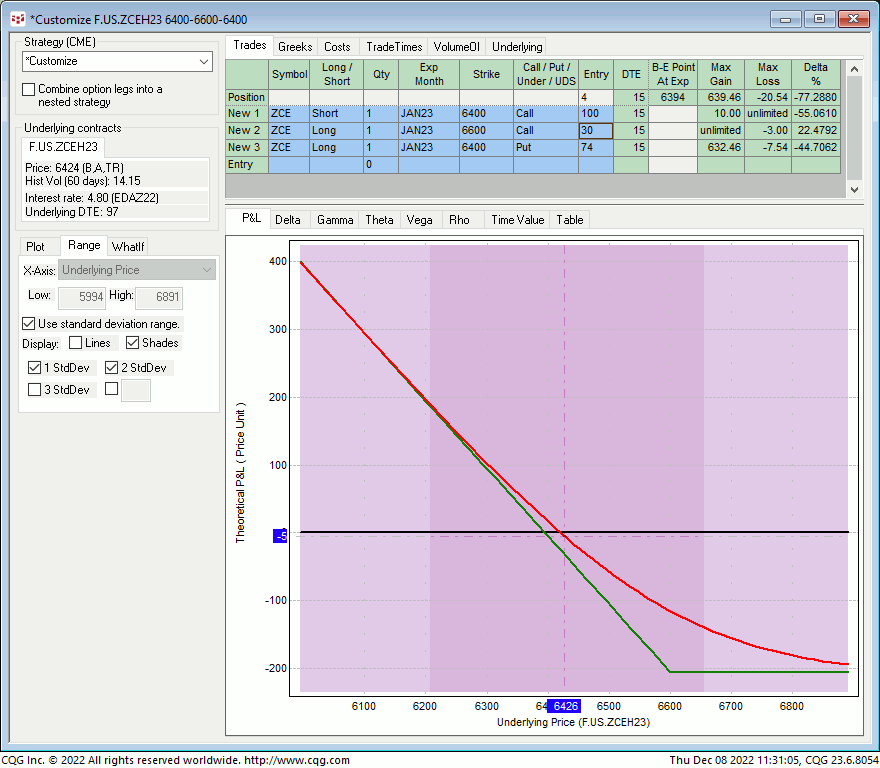
Given market-defined resistance in the 6.55-to-6.75-area, producers may want to consider the short Jan 6.40 – 6.60 Call Spread / long Jan 6/40 Put Combo as a bear hedge heading into tomorrow’s crop report. This particular crop report is not known for being an earth-shaking event. But in the event this report does surprise with bearish news, and given the bearish technical count until or unless threatened by a recovery above 6.74, this strategy will provide significant downside protection.
This combo strategy involves selling the Jan 6.40 – 6.60 Call Spread for around 7-cents and buying the Jan 6.40 Puts around 7-1/2-cents for a net initial cost of a 1/2-cent. This strategy provides:
- a current net delta of -77%
- favorable margins
- fixed, maximum risk/cost of 20-1/2-cents on ANY rally above 6.60
- virtually unlimited, dollar-for-dollar downside hedge protection below its 6.39 breakeven point at expiration 15 days from now on 23-Dec. And keep in mind, the market traded 6.36 two days ago.
Please contact your RJO representative for an updated bid/offer quote on this combo strategy and good luck on tomorrow’s numbers.


