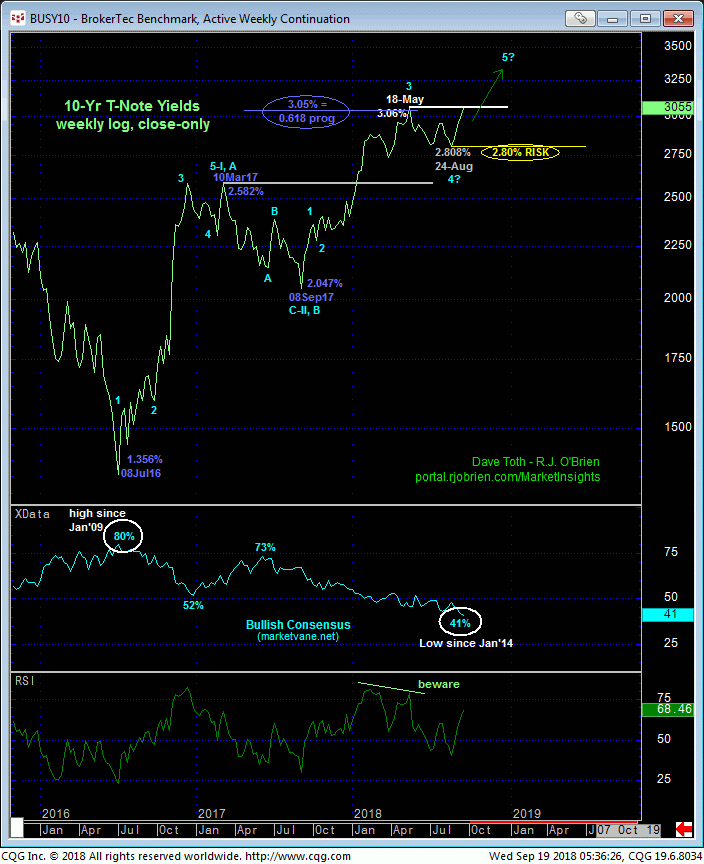
Yesterday’s accelerated decline to new lows for the past month’s slide leaves yesterday’s 119.105 high in its wake as the latest corrective high this market is now minimally required to recoup to confirm a bullish divergence in momentum, stem the decline and expose at least another interim corrective rebound within the past four months’ lateral range. In lieu of such 119.11+ strength it would be premature to bet against a resumption of the secular bear market to new lows below 17-May’s 118.105 low. In this regard shorter-term traders are advised to trail buy-stops to our new short-term risk parameter at 119.11 to protect bearish exposure from 120.175 in the then-prompt Sep contract recommended in 27-Aug’s Trading Strategies Blog.
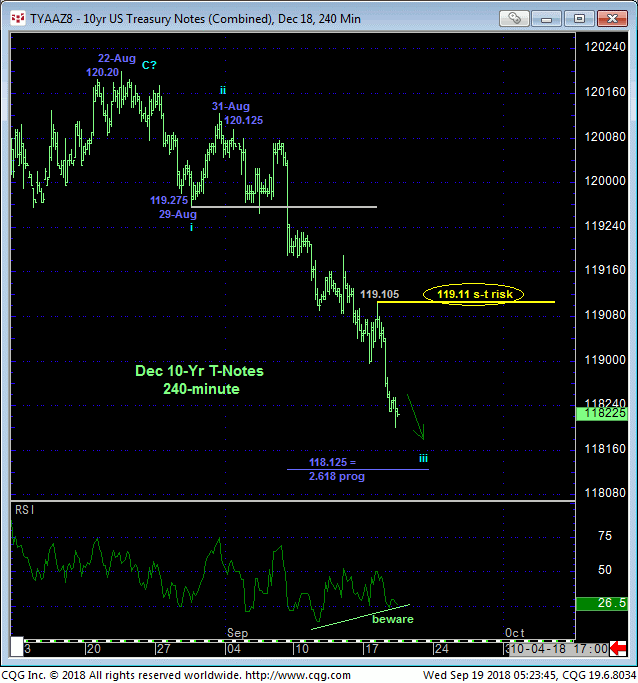
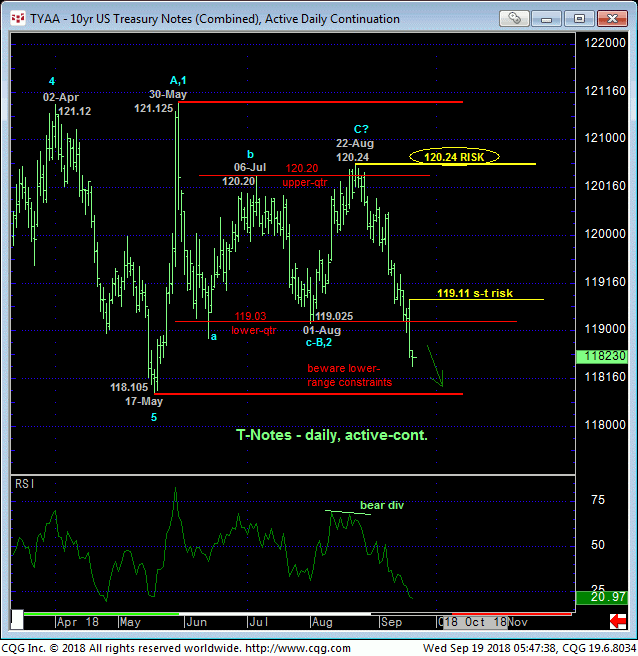
This tighter but objective risk parameter at 119.11 may come in handy given the market’s engagement of the lower-quarter of the past four months’ lateral range. If there’s a time and place to be leery of an intra-range trend ending and reversing, it would be here and now. The daily log close-only chart below of actual 10-yr yields shows the market’s proximity to 17-May’s 3.115% high daily close that would not surprise if it maintained its resistant cap.
This said and as we’ll discuss below, against the backdrop of a still-arguable secular bear market in the contract (move up in rates), the relatively minor recovery attempt from May’s 118.105 low to the 120.24-to-121.125-range that capped the past four months’ easily fits the mould as a corrective/consolidative affair that warns of a resumption of the major downtrend that preceded it. In this regard neither should a breakdown below 118.10 (bust-out above 3.12%) come as a surprise.
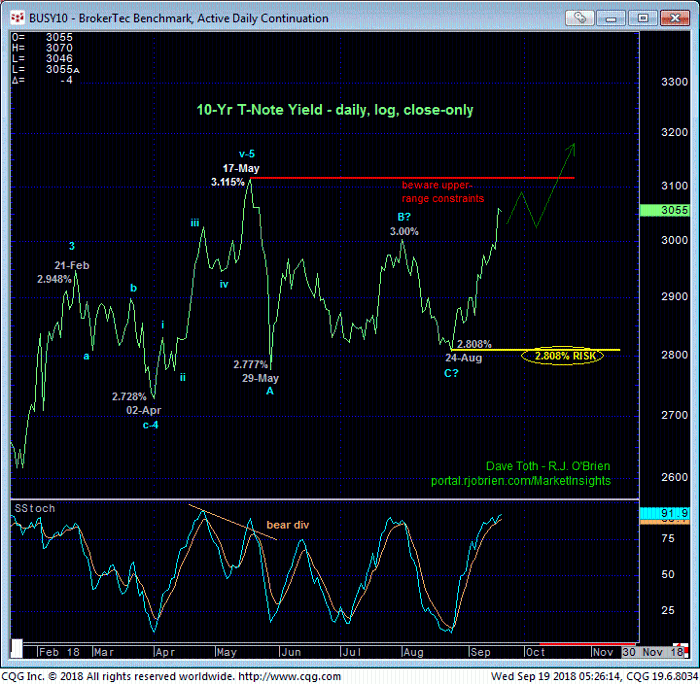
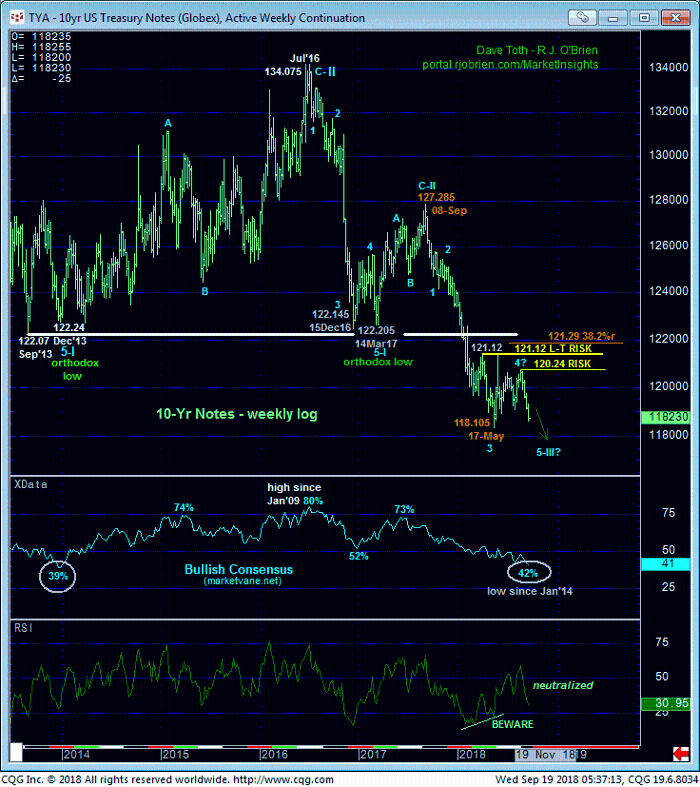
Indeed, the weekly chart of the contract above and weekly log close-only chart of 10-yr yields below show the relatively minor rebuttal to Sep’17 – May’18’s portion of the secular bear trend, let alone the even broader 2-YEAR downtrend. On this broader scale a recovery in the contract above 22-Aug’s 120.24 larger-degree corrective high and key risk parameter (below 2.80% yield) is required to threaten our long-term bearish count.
These issues considered, a bearish policy and exposure remain advised with a recovery above 119.11 required to defer or threaten this call enough to warrant moving to a neutral/sideline and circumvent the aimless whipsaw chop expected from the market’s reversion to the 4-month range. In lieu of such 119.11+ strength we anticipate further and possibly accelerated losses straight away, including a resumption of the secular bear market to new lows below 118.10.
