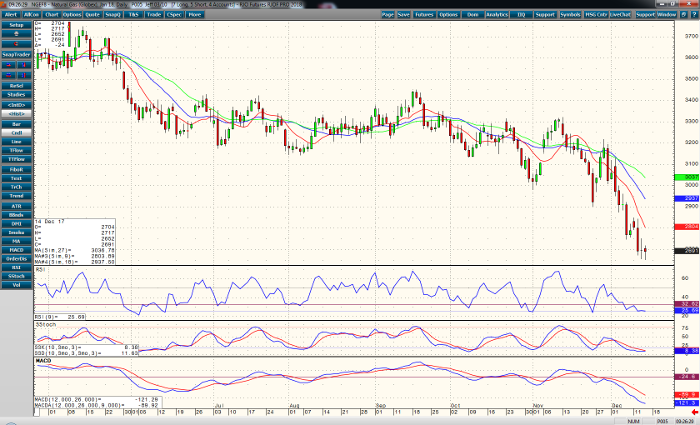
The bears have a firm grip on the January natural gas market. The overall trend is clearly down. We’ve broken through the multi-year low from February of 2016 of 2.720 and the selloff continues. Pivot point calculations have support at 2.659 and below at 2.623. A close below 2.623 may signal sub 2.500 declines with 2.492 a realistic down side target. All short-term averages (9, 18, and 27) are trending lower, with momentum studies (RSI, MACD, and Stochastics) confirming direction. They are also dipping into oversold territory, until we see divergence between price action and momentum the current trend should continue downward.
Warmer weather going into the weekend should curb some of the heating demand – winter is taking its time arriving this year. The Midwest should expect above freezing temperatures through the next week with colder weather forecasted for the last days of the year. This might temper the selling over the coming week. A draw of -55 bcf is the expected weekly storage number. This number is above the 5-yr average of -79 bcf draw. The market is trending lower. I’m bearish until I see a reason, technical or fundamental.
Natural Gas Jan ’18 Daily Chart


