Posted on Dec 09, 2022, 10:32 by Dave Toth
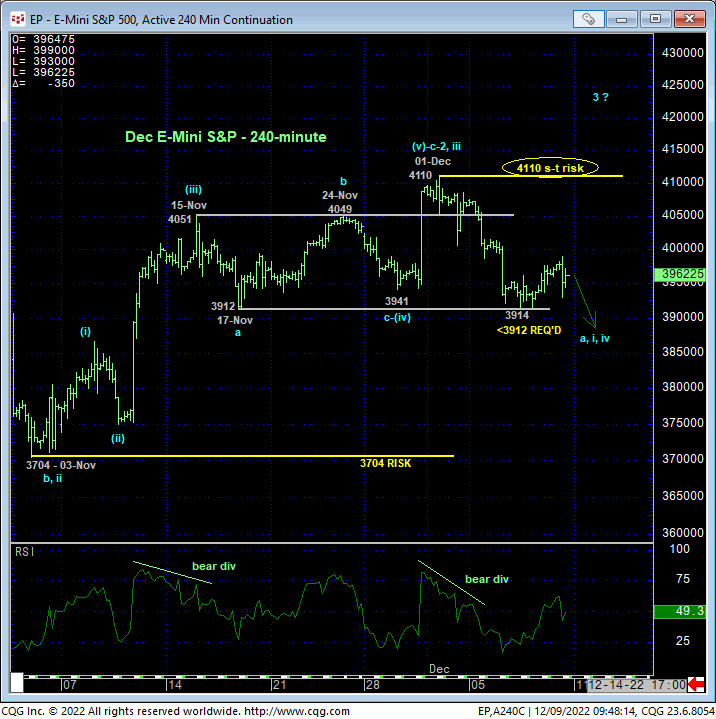
In 23-Nov’s Technical Blog we identified 17-Nov’s 3912 low as another corrective low within Oct-Nov’s developing recovery and our new short-term risk parameter the market needed to fail below to confirm a bearish divergence in momentum and expose either another interim corrective setback or possibly the resumption of this year’s major bear trend. Since then, the 240-min chart below shows the market continuing on to a new high of 4110 before the past week’s setback.
While the extent of this setback warns that that 4110 high might have completed a 5-wave sequence up from 03-Nov’s 3704 low, this market has yet to crack 17-Nov’s 3912 low on an intra-day basis. Per such, this 3912 level is building in importance as a pivotal one around which shorter-term traders with tighter risk profiles can objectively toggle directional exposure. A clear break below 3912 will reinforce at least the intermediate-term downtrend that could morph into a more protracted reversal lower. Until and unless this market breaks below 3912 however, it would be short-sighted and presumptive not to continue to acknowledge this area as a key support within a still-developing recovery.
This said, for those suspicious of a peaking/vulnerable condition, a recovery above 4110 will mitigate such and reinstate the nearly 2-month recovery. Per such, 4110 may be used as an objective parameter from which to base non-bullish decisions like long-covers and cautious bearish punts.
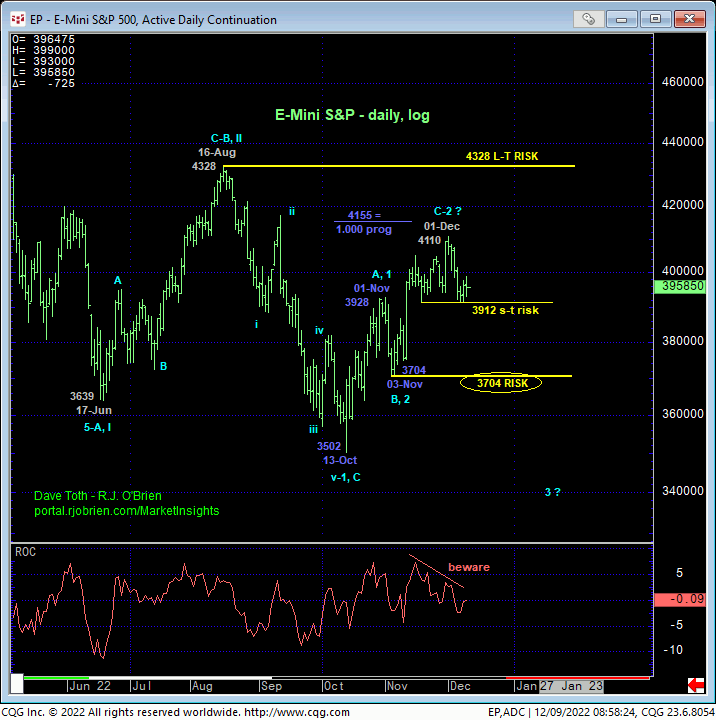
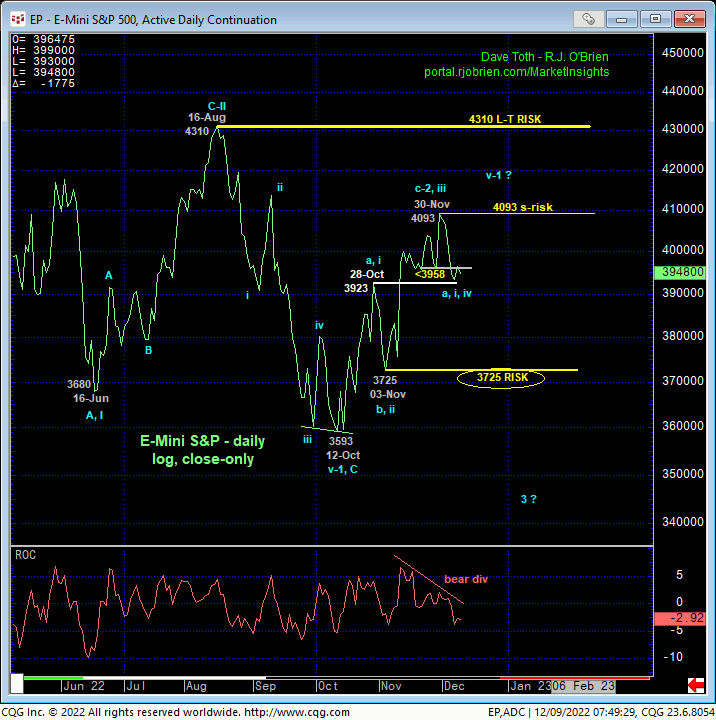
Stepping back, the daily log scale high-low chart above shows clearly waning upside momentum, but again, a failure below 3912 remains required to CONFIRM this divergence and 4110 as a more legitimate high, resistance and new short-term bear risk parameter. On a daily log close-only basis however, the chart below shows a couple of closes below 21-Nov’s 3958 corrective low close that DOES confirm a bearish divergence in momentum. This mo failure defines 30-Nov’s 4093 high close as the end of a nice 5-wave rally from 03-Nov’s 3725 low close and possibly the end of a 3-wave structure up from 12-Oct’s 3593 low. The importance of this prospective 3-wave recovery from the Oct low cannot be emphasized enough as it would be consistent with a mere correction within this year’s secular bear trend to eventual new lows below 3500.
Even on this daily close-only basis however, the market is sustaining levels above former 3923-area resistance-turned-support as one would expect per a still-developing broader trend higher. Indeed, the past week’s setback attempt falls well within the bounds of a (prospective 4th-Wave) correction ahead of a (5th-Wave) resumption of this rally to new highs above 4093/4110.
On an appropriately larger-degree scale, commensurately larger-degree weakness below 03-Nov’s 3725 low close and/or that day’s 3704 intra-day low remains required to render the recovery from 13-Oct’s 3502 low a 3-wave and thus corrective affair that, at that point, we re-expose the secular bear market. In this regard, those 03-Nov lows at 3725/3704 remain intact as our key longer-term bull risk parameters pertinent to longer-term institutional players and investors.
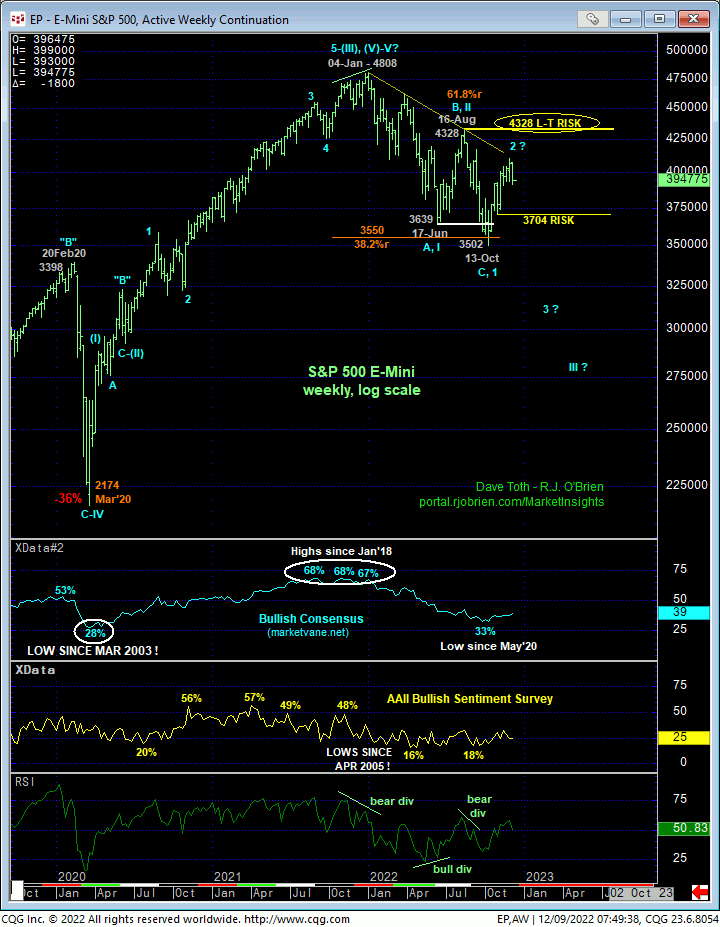
Stepping back even further, the market has yet to recoup 16-Aug’s larger-degree corrective high at 4328 needed to, in fact, break this year’s major downtrend. In this very long-term regard, the recovery from 13-Oct’s low is no less a bear market correction than Jun-Aug’s corrective recovery from 3639 to 4328. Again, herein lies the pivotal importance of what this market does around these three key levels in the period ahead: 4110, 3912, and 3704. These are the levels traders are advised to toggle directional biases and exposure around commensurate with their personal risk profiles.
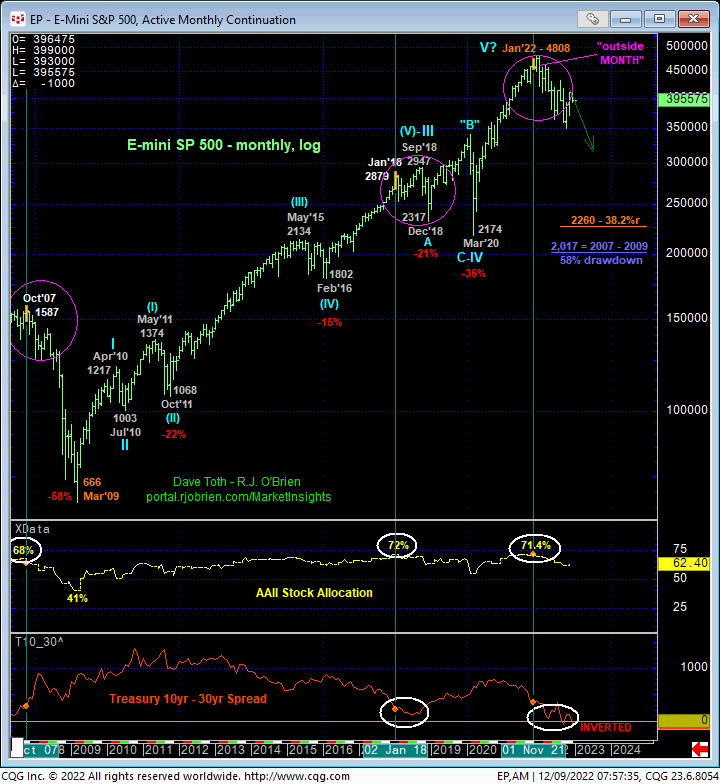
And one final thought. Since late-Jan, we’ve presented the technical facts that warn of a correction or reversal lower that may be major in scope and similar to 2007 – 2009 and 2000 – 2002 major bear markets. While the past month-and-a-half’s recovery has at least deferred this bear and may be in the process of threatening it, for reasons discussed above it would be premature to conclude this year’s decline ended at 3502. Against this backdrop, THE ONE THING that would be absolutely reprehensible to miss or misdiagnose, as an analyst or an investor, is a major bear market similar to 2007/2009 and 2000/2002. The important takeaway from Oct/Nov’s recovery, just like Jun-Aug’s recovery, is that this market has identified a ton of price action between spot and 13-Oct’s 3502 low that the bear now has to break below to rear its ugly and opportunistic head again. In other words, IF there’s still a major (say 50%) drawdown ahead, it will NOT come as a surprise and it WILL provide every opportunity to take defensive measures. And we will certainly keep customers apprised of the key developments- both bullish and bearish- for as long as it takes to navigate the next directional opportunity appropriately and, as always, with specifically defined risk parameters.
