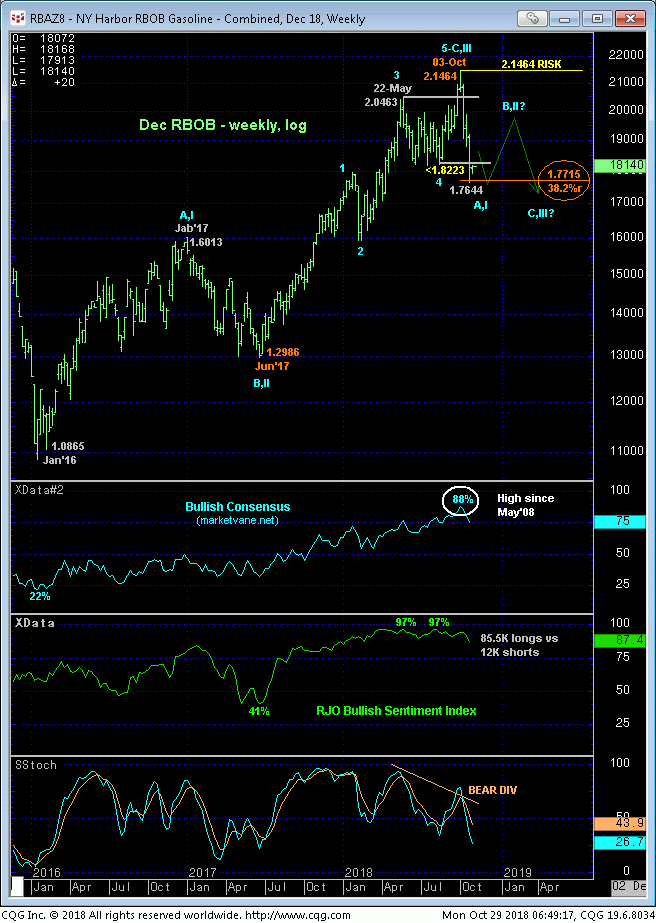
In last Wed’s Technical Blog we discussed the potential long-term ramifications of the market’s bearish divergence in WEEKLY momentum from a new high for the 33-month bull in any particular contract. Indeed, in just a few short weeks this bearish divergence in momentum shown in the weekly log chart of the now-prompt Dec contract defines 03-Oct’s 2.1474 high as the end of the uptrend from at least Jun’17’s 1.2986 low. This is a 16-MONTH uptrend broken in just three weeks.
Combined with historically frothy levels of bullish sentiment that, in the case of the Bullish Consensus (marketvane.net) haven’t been seen in over 10 YEARS, this major mo failure warns of a peak/correction/reversal environment that could be major in scope as long as 03-Oct’s 2.1464 high remains intact.
However, the forces that drove such a major bull aren’t likely to evaporate so quickly such that an obvious reversal like we’ve seen the past few weeks will just keep going. Rather and typically of peak/reversal processes, somewhere along the line traders should not be surprised by a corrective rebuttal to the Oct swoon that could be equally extensive in terms of both price AND time. Per such we are keeping a keen eye on a sell-off stemming bullish divergence in even short-term momentum that could expose such a rebound.

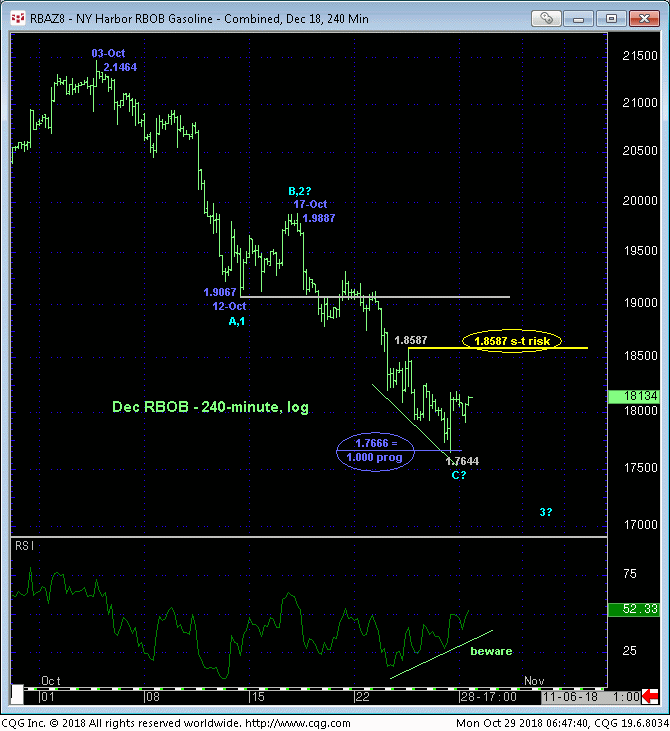
Drilling down to a 240-min chart of the Dec contract below, the POTENTIAL for such a bullish divergence is developing, with the past few days’ continued slide leaving Wed’s 1.8587 high in its wake as the latest smaller-degree corrective high the market would be required to sustain losses below to maintain a more immediate bearish count. Its failure to do so will confirm a bullish divergence in mo, stem the slide and expose at least an interim correction higher.
Per this base/correction threat are a couple Fibonacci relationships that are compelling. First, we think its interesting that Fri’s 1.7644 low was less than a quarter-cent from the (1.7666) 1.000 progression of the initial decline from 03-Oct’s 2.1464 high to 12-Oct’s 1.9067 low from 17-Oct’s 1.9887 corrective high as labeled in the 240-min chart below. Also, neighboring 1.7715 is the 38.2% retrace of the 16-month rally from Jun’17’s 1.2986 low to 03-Oct’s 2.1464 high shown in the weekly log chart above. IF the market confirms a bullish divergence in short-term momentum above 1.8587, these Fib relationships and possible 3-wave (and thus corrective) decline from 03-Oct’s 2.1464 high could mean a more significant rebound than even one within a broader peak/reversal-threat process.
These issues considered, the trend remains down on any practical scale and should not surprise by its continuance, with a recovery above 1.8587 required to stem the slide and expose a recovery that could be extensive. Per this setup and while admitting the market has yet to confirm the bullish divergence in short-term mo, traders are advised to move to a neutral/sideline position for the time being. Scalpers are OK to take a cautious punt from the bull side with a failure below Fri’s 1.7644 low negating this call.


