DEC 10-Yr T-NOTES
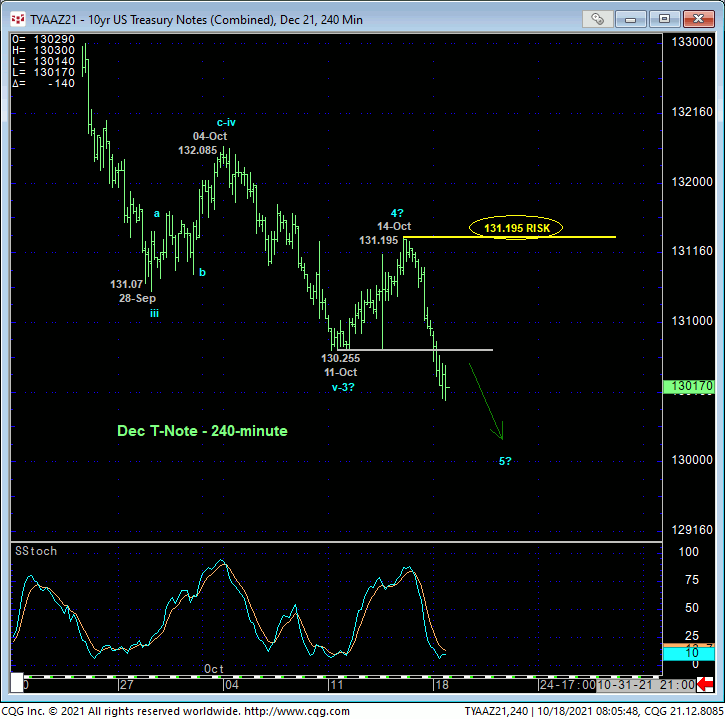
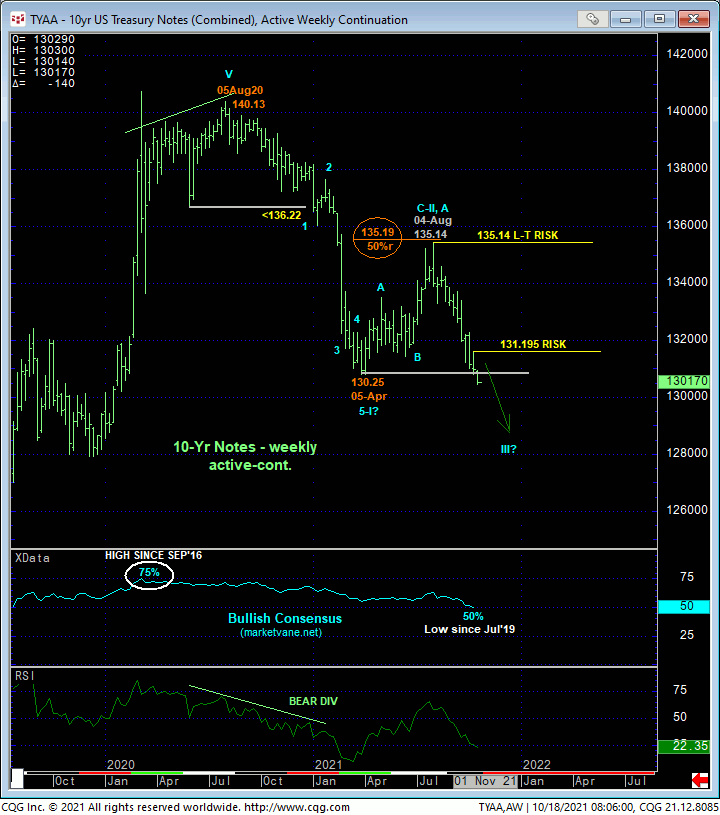
As a precursor to our S&P update, both equity and fixed income traders should take special note of overnight’s continued plunge in the T-note contract. Today’s break below last week’s 130.255 low reaffirms the major downtrend with the very important by-product being the market’s definition of 14-Oct’s 131.195 high as the latest corrective high and level this market is now minimally required to recoup to confirm a bullish divergence in momentum, arrest the plunge and expose at least an interim corrective rebound. Per such, this 131.195 level becomes our new relatively short-term but key risk parameter from which a still-advised bearish policy and exposure can be objectively rebased and managed.
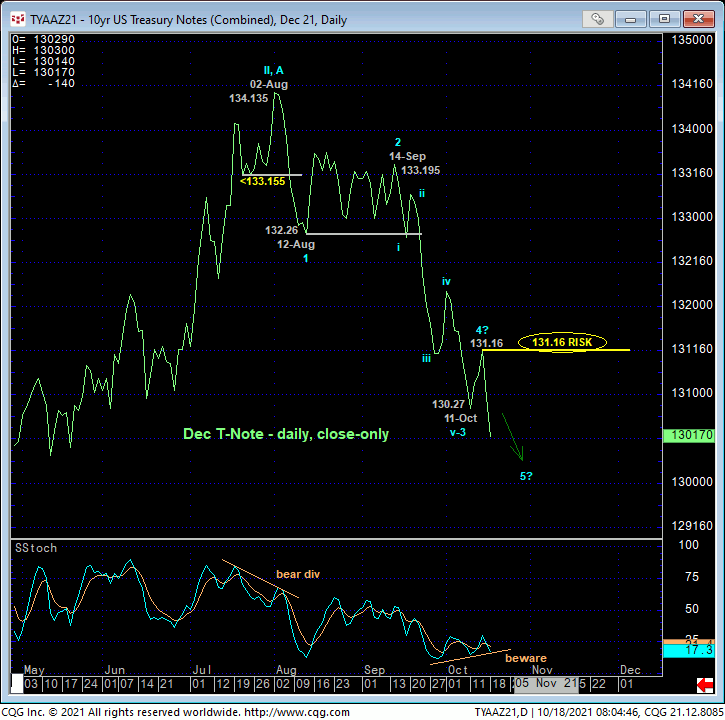
The daily close-only chart of the 10-yr contract above shows today’s clear continuation of the 2-1/2-MONTH downtrend as well as the developing POTENTIAL for a bullish divergence in momentum. A close above 14-Oct’s 131.16 corrective high close or an intra-day recovery above 131.195 is needed to CONFIRM this divergence to the point of non-bearish action like short-covers.
On a yield basis shown in the daily chart below, this key risk parameter is Thur’s 1.506% corrective low. This is a key threshold as, on a yield basis and unlike the contract, the market has yet to take out 30-Mar’s obviously critical 1.778% high needed to, in fact, reinstate the secular uptrend in rates. If there’s a time and place to be leery of at least another interim peak in rates, it is here and now at the upper-quarter of this year’s range, and we will gauge such a bearish divergence in momentum precisely around 1.506%. Until such a relapse in rates is proven, further and possibly accelerated rate hikes should not surprise.
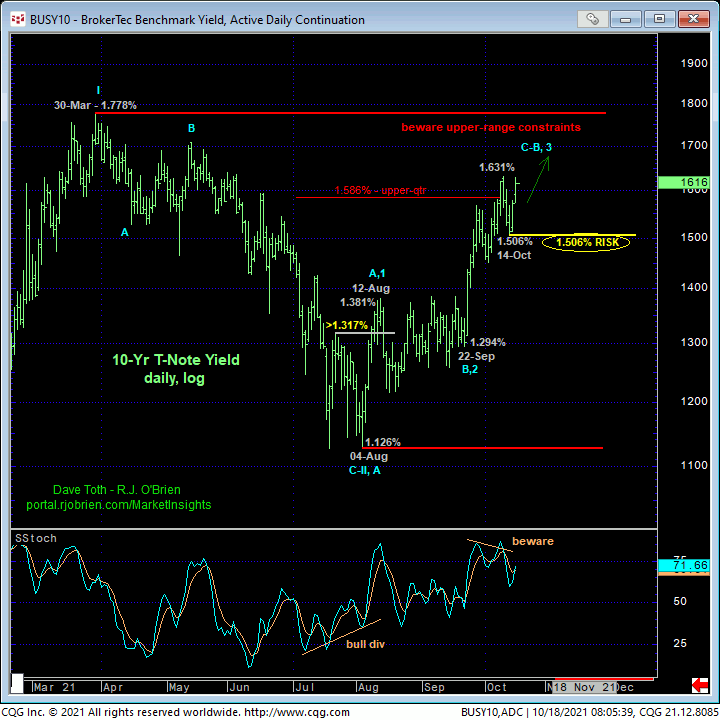
Finally, the weekly active-continuation chart of the contract below shows today’s resumption of the secular bear trend below 05-Apr’s 130.25 low. With 10-yr rates still above 17-bps away from its key 30-Mar high, something’s gotta give. Either the contract breakdown is a falsie or rates will continue higher straight away. Traders are urged to be leery of this battle and adjust accordingly around the 131.195 and 1.506% risk parameters.
These issues considered, a bearish policy remains advised with a recovery above 131.195 required to defer or threaten a bearish policy enough to warrant a move to the sidelines. In lieu of such strength, further and possibly accelerated losses remain expected.
JUN23 EURODOLLARS
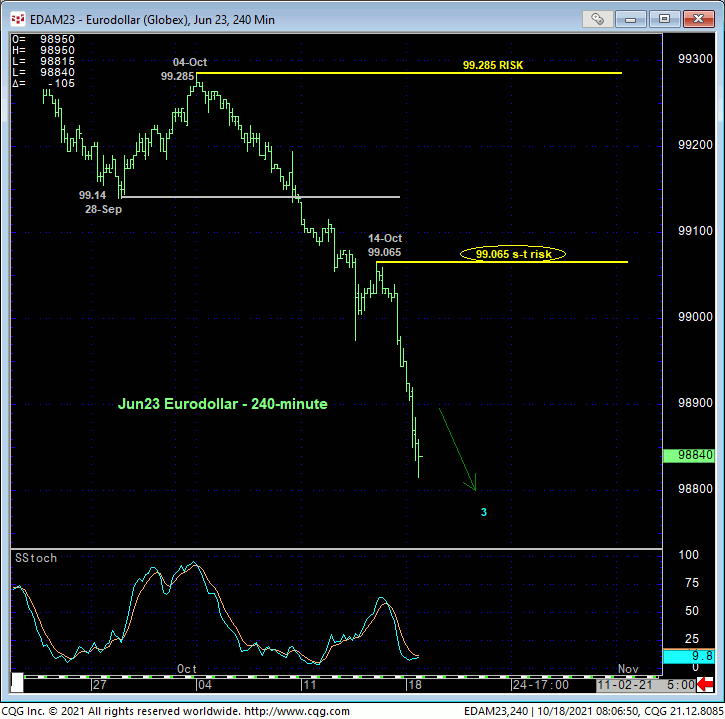
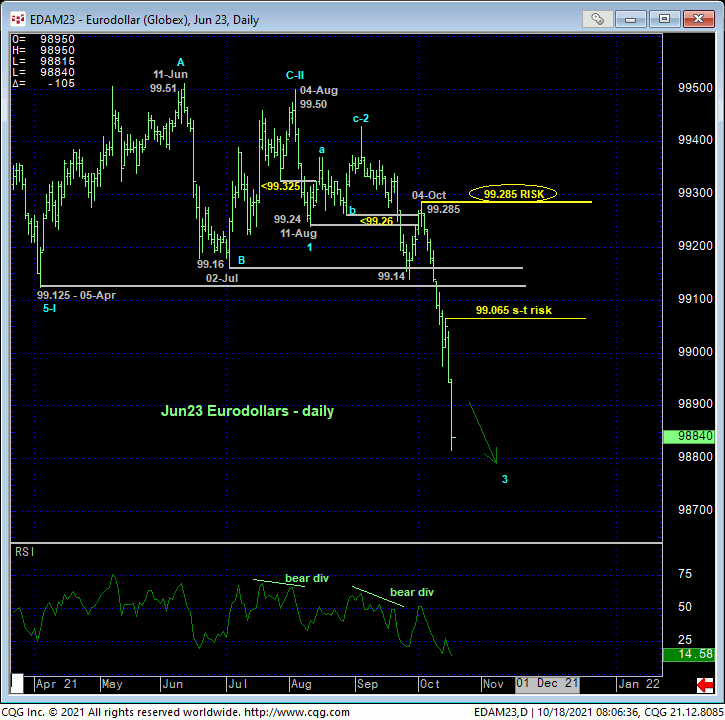
The spike up in rates and down in prices is even more egregious on the short end of the curve as indicated by the past couple day’s sharp continuation of last week’s break below 05-Apr’s pivotal 99.125 low. This accelerating meltdown obviously reinforces our bearish count and leaves smaller- and larger-degree corrective highs in its wake at 99.065 and 99.285, respectively as our new short- and long-term risk parameters from which traders can objectively rebase and manage the risk of still-advised bearish policies and exposure commensurate with their personal risk profiles.
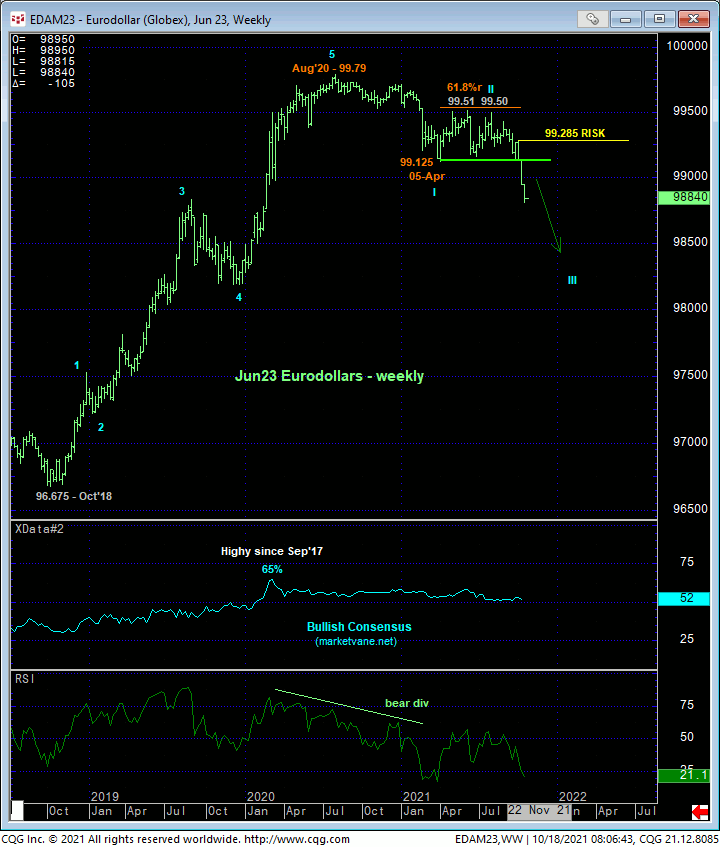
The weekly chart below clearly shows the past couple week’s resumption of a peak/reversal process that dates from Aug’20’s 99.79 all-time high and that we believe can be generational in scope. To even defer this major bearish count, let alone threaten it, this market is required to recover above 04-Oct’s 99.285 lager-degree corrective high. In lieu of such strength, further and possibly massive, irreversible losses should not surprise. And as we’ll discuss below, it is only a matter of time before rising rates have a negative impact on equities.
In sum, a full and aggressive bearish policy and exposure remain advised with a recovery above at least 99.065 and preferably 99.285 required to defer or threaten this call to the point of paring or neutralizing exposure. In lieu of such strength, further and possibly steep, accelerated losses straight away should not surprise.
DEC E-MINI S&Ps
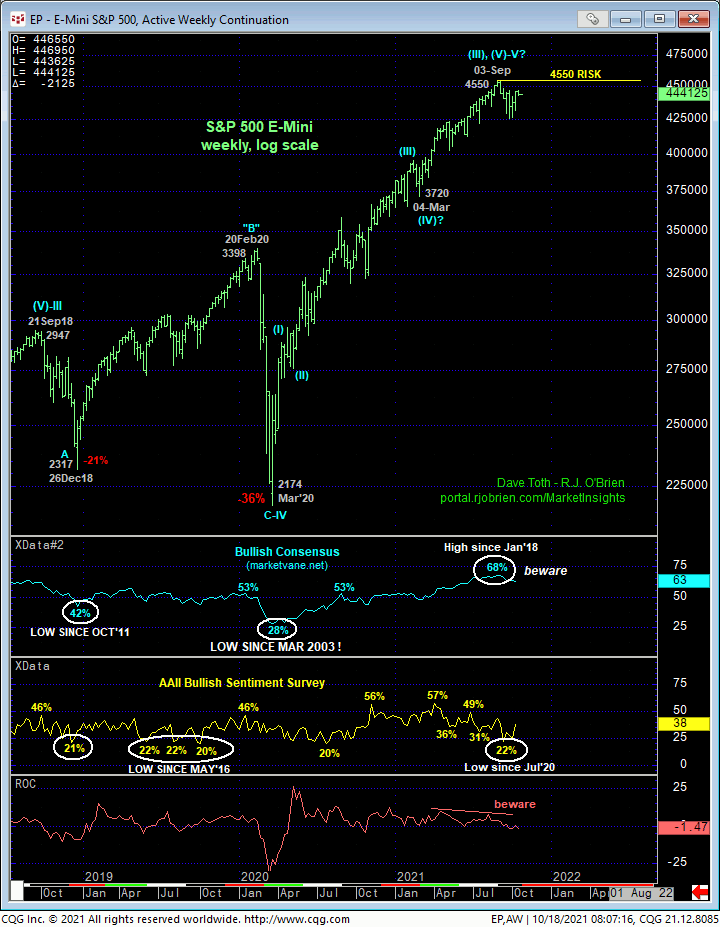
Against the backdrop of rising rates, we’d like to draw traders’ attention to 12-Oct’s 4317 low detailed in the 240-min chart below. This is the latest smaller-degree corrective low left in the wake of Thur’s recovery above 07-Oct’s 4422 initial counter-trend high that, as we’ll show below, confirms a bullish divergence in daily momentum. This strength confirms at least the intermediate-term trend as up and leaves that 4317 low as THE low this market now needs to sustain trendy, impulsive price action above to maintain a more immediate bullish count. Its failure to do so will not only render the recovery attempt from 01-Oct’s 4260 low a 3-wave and thus corrective affair, it would resurrect a peak/reversal threat that could be major in scope. Per such, this 4317 level serves as our new short-term risk parameter from which non-bearish decisions like short-covers and cautious bullish punts can be objectively based and managed.
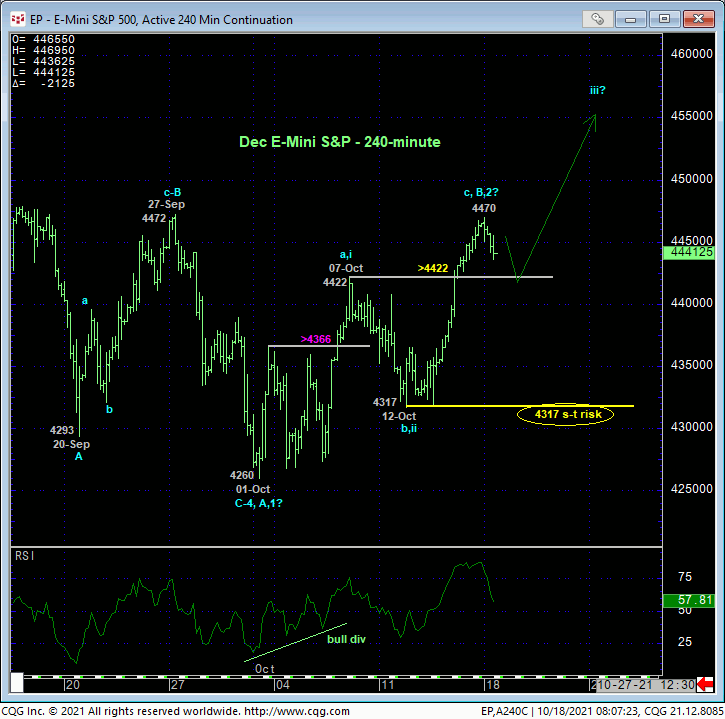
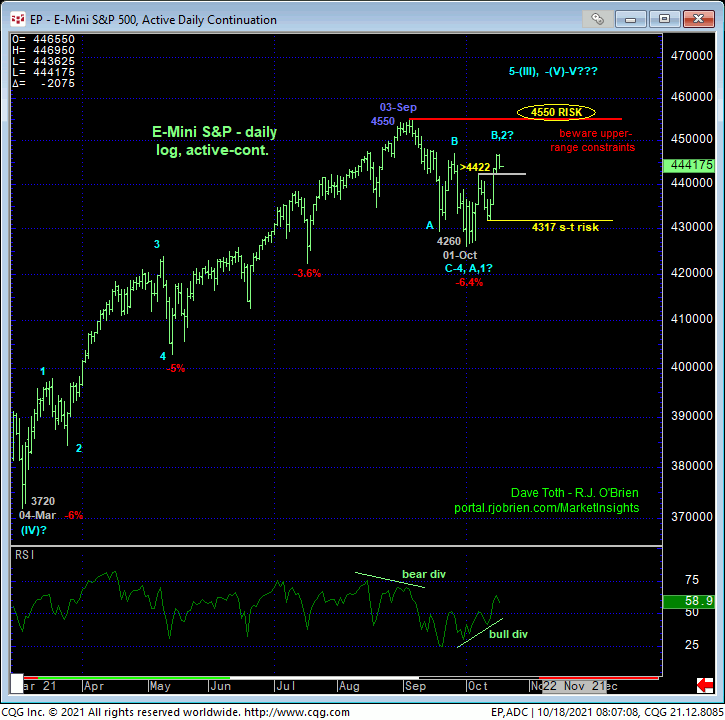
Stepping back, last week’s recovery is important to bulls because it confirms a bullish divergence in daily momentum and marks recent lows at 4317 and certainly 4260 as levels from which a resumption of the secular bull trend can be based and managed. As 03-Sep’s 4550 high has yet to be taken out to, in fact, reinstate the secular bull, we have to allow for a broader bearish count that contends this month’s recovery attempt is just a corrective B- or 2nd-Wave within would still could be a major peak/reversal threat. A recovery above 4550 and our key long-term risk parameter will negate this bearish prospect and reinstate the bull while a relapse below 4317 will tip the directional scales lower. Subsequent weakness below 4260 could open floodgates to levels indeterminately lower. Herein lies the danger and outstanding opportunity of sharply rising interest rates.
These issues considered, we believe this market has identified 4317 and 4550 as the key directional triggers heading forward. Traders are advised to toggle directional biases and exposure around these levels commensurate with their personal risk profiles.
