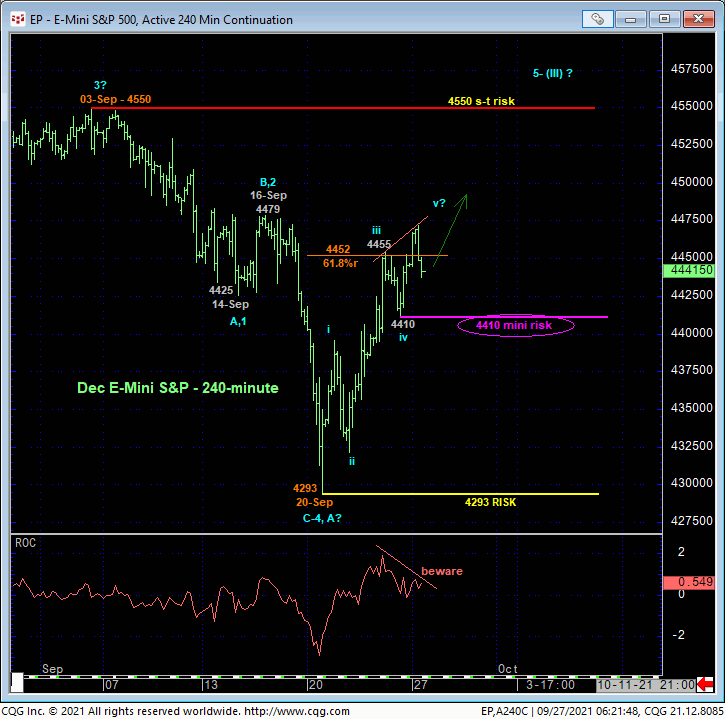
We’re going to preface this update with the Dec S&P’s overnight break above Thur’s 4455 high that reaffirms the past week’s 5-wave, impulsive-looking recovery and defines Fri’s 4410 low as the latest smaller-degree corrective low the market needs to sustain gains above to maintain a more immediate bullish count. It’s failure to do so will confirm a bearish divergence in short0-term momentum and arrest this recovery from what we believe is a pivotal low at 4293 from 20-Sep. In this very short-term regard, Fri’s 4410 low serve as a mini risk parameter around which shorter-term traders with tighter risk profiles can objectively base non-bullish like long-covers from the typically notorious middle-half of the past month’s range where the odds of aimless whipsaw risk are higher.
Another thing that could be important about a sub-4410 admittedly mini momentum failure is that it follows a “more extensive” (i.e. greater than 61.8%) retrace of early-Sep’s 4550 – 4293 decline. As we’ll discuss below and despite what appears to be a clear 3-wave and thus corrective early-Sep decline, this decline was also one of the more extensive setbacks against the secular bull trend over the past year. A resumption of this decline below 20-Sep’s 4293 low would, we believe, reinforce a peak/reversal threat that could be major in scope. We would not be able to conclude a sub-4293 relapse from just a mini mo failure below 4410, but such a mini mo failure would reject/define a specific high and risk parameter that we then could objectively require the market to recover above to reinforce a broader bullish count.
Trying to navigate directional moves from the middle-halves of ranges is suicide due to whipsaw risk typical of such conditions. But we’re placing emphasis on these two levels- 4410 and certainly 4293- because of the past few days’ accelerated rise in Treasury rates consistent with our long-term bearish count in the T-note contract where, somewhere along the line, we have to acknowledge and prepare for potentially significant bearish ramifications in equities. We want and need to beware that that “line” may be sooner rather than later.
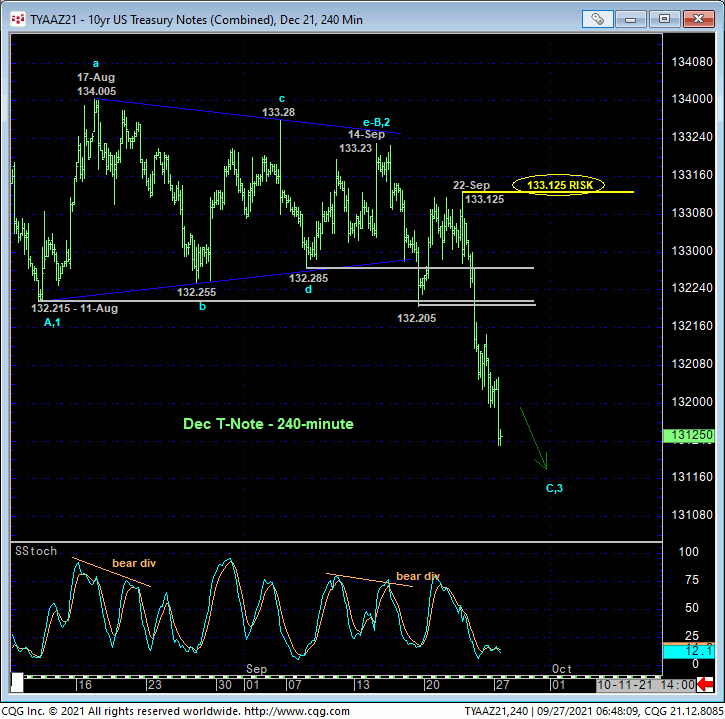
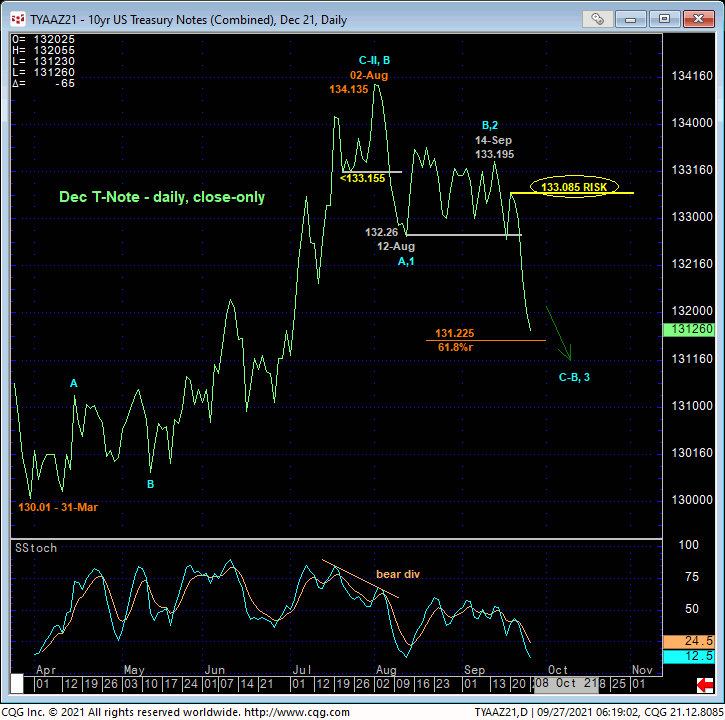
Only a glance at the 240-min chart above and daily close-only chart below is needed to see the extent and impulsiveness of the past few days’ collapse below the prior five weeks’ support around the 132.21-to-132.28-area that reinforces our bearish count resurrected in 17-Sep’s Technical Blog. This weakness clearly defines 22-Sep’s 133.125 high as a recent corrective high that we believe has longer-term implications. 133.125 is THE level this market now needs to recoup to render the broader sell-off attempt from 02-Aug’s 134.135 high daily close (below) a 3-wave and thus corrective affair that would re-expose the uptrend from 31-Mar’s 130.01 low. Until and unless such strength is shown, there’s no way to know that the decline from 14-Sep’s 133.195 high close and that day’s 133.23 intra-day high isn’t the dramatic 3rd-Wave of a major reversal lower and possibly the resumption of what we believe is a new secular bear market in the contract from Aug’20’s 140.13 all-time high.
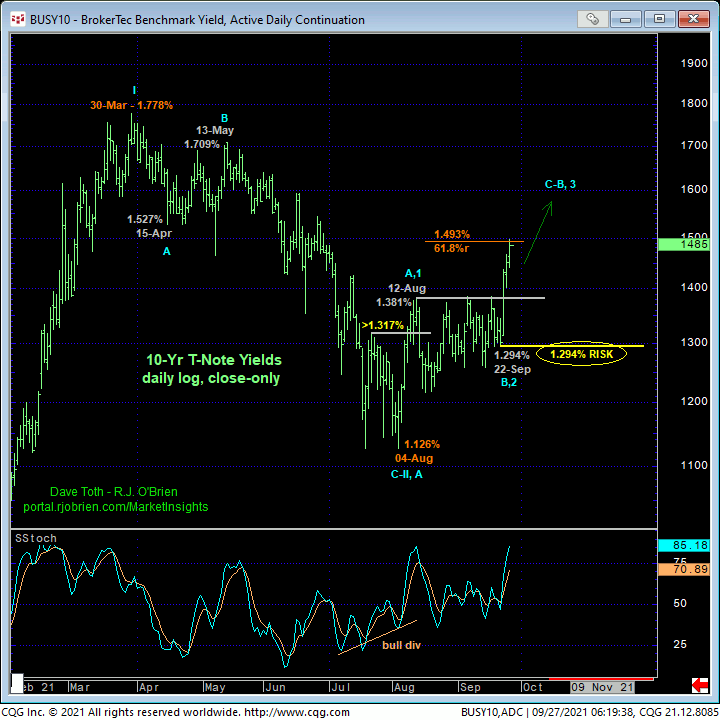
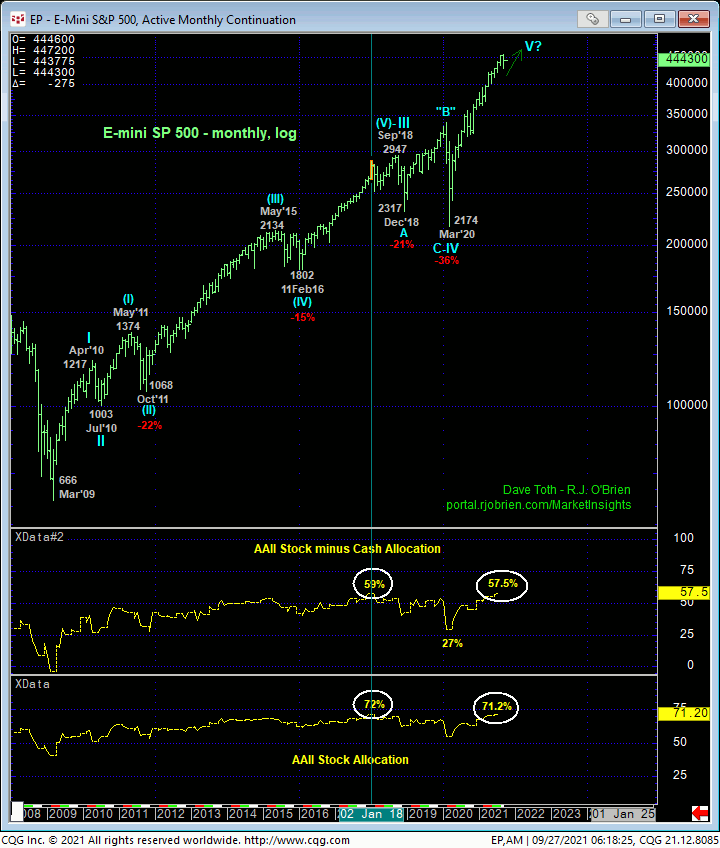
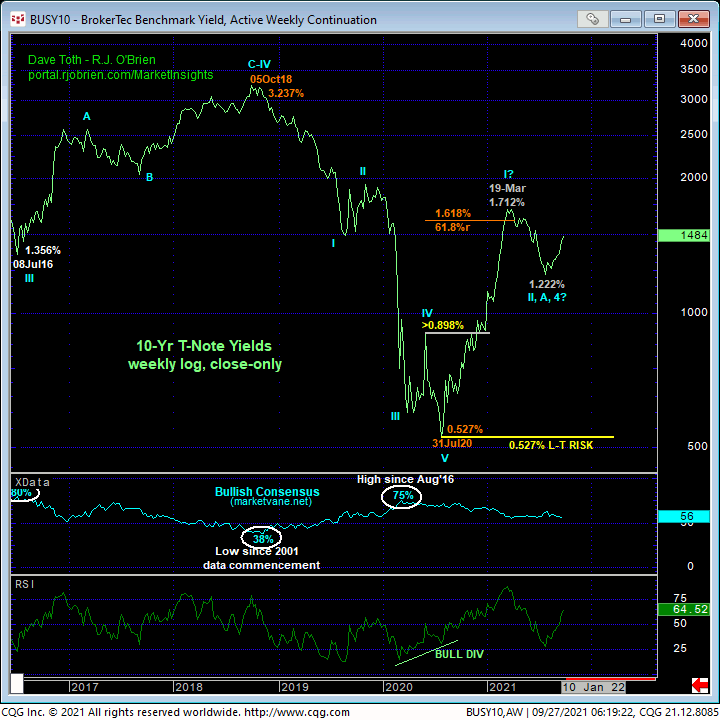
Looking at it from an actual 10-yr yield perspective above (daily) and below (weekly), Thur’s punch-out above the prior FIVE WEEKS’ 1.38%-area highs and resistance reinforces a broader base/reversal of Mar-Apr’s entire sell-off attempt from 1.778% to 1.126%. Admittedly, the reversal that now has nearly two months of basing behavior beneath it has thus far only retraced 6.8% of Mar-Aug’s 1.778% – 1.126% decline and remains well within the bounds of the 1.778% – 1.126% RANGE that could continue to constrained rates for months ahead. But until derailed by a bearish divergence in momentum, there’s no way to know at this juncture that the current rally isn’t the dramatic 3rd-Wave of a broader sequence up from 04-Aug’s 1.126% low that would test and eventually break 30-Mar’s 1.778% high. And if this is what this market has in mind, it’s not hard to envision a potentially very detrimental effect on stocks, especially with some sentiment/contrary opinion indicators at historic heights.
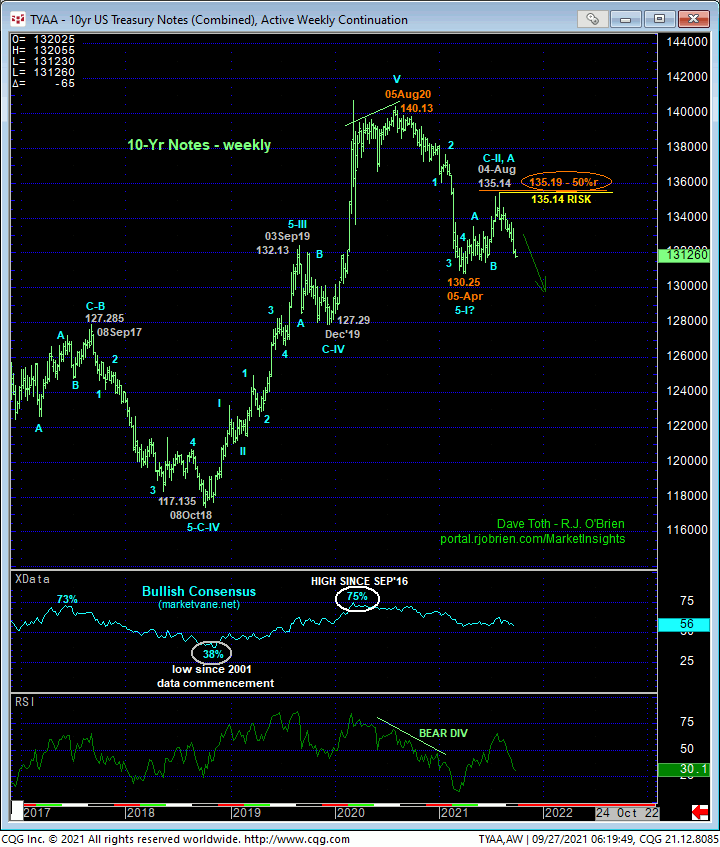
Lastly and as we’ve discussed for months, the weekly chart of the contract below shows the extent and 5-wave impulsiveness of the decline from Aug’20’s 140.13 all-time high to 05-Apr’s 130.25 intra-day low that we believe is just the initial 1st-Wave of a mammoth peak/reversal process of the 39-YEAR secular bull market in Treasuries. The past seven weeks’ relapse is enough to render the recovery attempt from the Apr low a 3-wave and thus corrective structure consistent with our long-term bearish count. The Fibonacci fact that Apr-Aug’s recovery came with 5/32s of the (135.19) 50% retrace of Aug’20 – Apr’21’s 140.13 – 130.25 decline would seem to reinforce this bearish count.
Since the market hasn’t yet relapsed below Apr’s 130.25 low however, it would be premature to conclude the secular bear trend’s resumption at this point, as opposed to further intra-130.25-to-135.14-range lateral consolidation that could span weeks or months more. But again, if this more lateral path is what the market has in store, than somewhere along the line it needs to arrest the current and clear and at least intermediate-term downtrend with a confirmed bullish divergence in momentum. And as identified above, this currently would require a recovery above 133.125.
These issues considered, a bearish policy and exposure remain advised with a recovery above 133.125 required to negate this specific call and warrant its cover. In lieu of such strength, further and possibly accelerated losses (higher rates) remain expected.
JUN23 EURODOLLARS
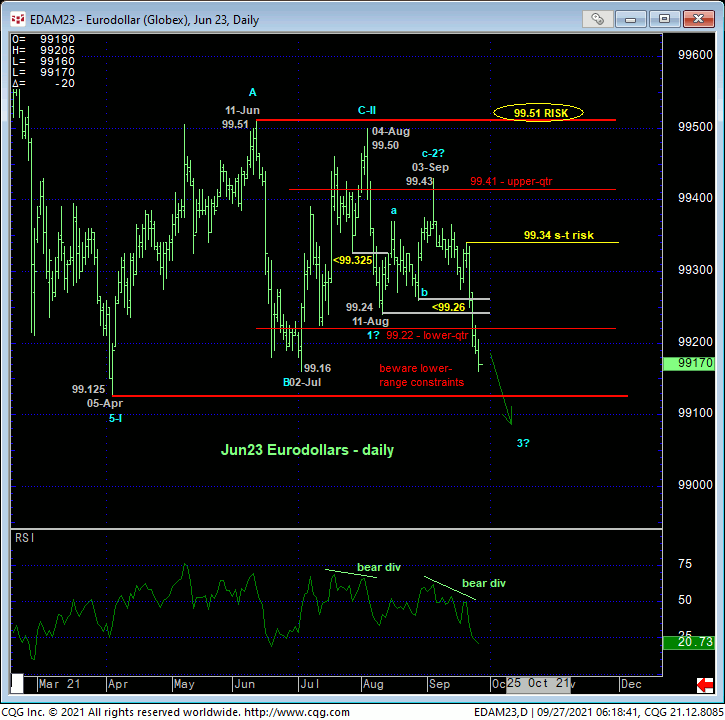
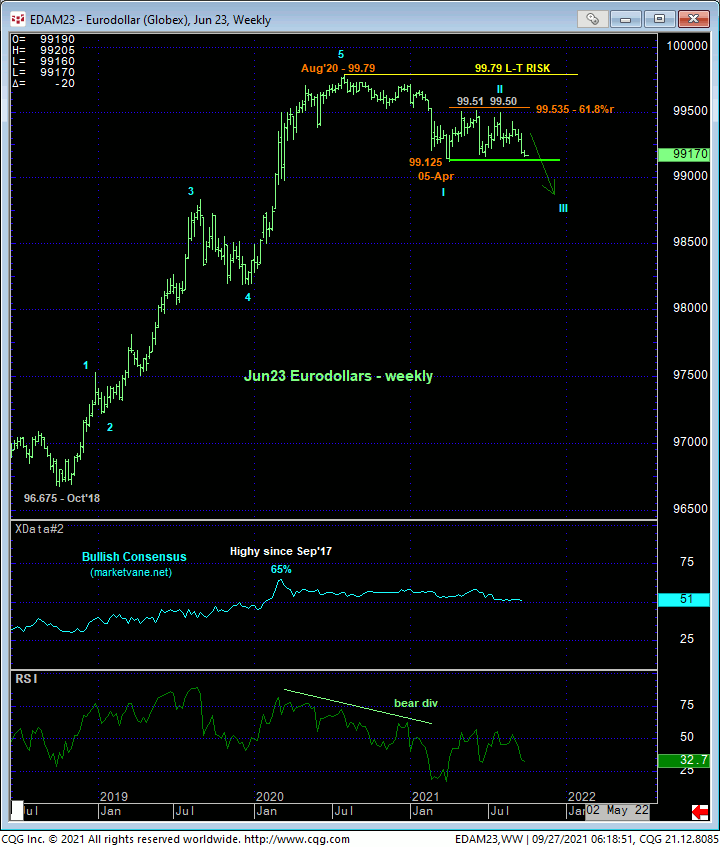
This market’s clear and impulsive break last Thur/Fri below the 99.26 and 99.24 lows and support from early- and late-Aug reinforce our long-term bearish count that’s consistent with our count in T-notes. On the heels of Aug’20 – Apr’21’s trendy, impulsive (1st-Wave) decline shown in the weekly chart below, the subsequent recovery attempt to 04-Aug’s 99.50 high is about as (2nd-Wave) labored and corrective as it gets, warning of an eventual (3rd-Wave) meltdown below the 99.12-to-99.16-area lows and support. And once below 99.12, there are NO levels whatsoever of any technical merit to hold it up.
The past week’s resumed slide leaves 21-Sep’s 99.34 low in its wake as the latest smaller-degree corrective high this market is now minimally required to recover above to defer or threaten this call. This risk parameter may come in handy given that the market hasn’t yet broken the key 99.16-to-99.12 lower boundary to the six-month lateral range. But until and unless such 99.34+ strength is shown and/or the market confirms a bullish divergence in at least short-term momentum from the lower recesses of this key range, a bearish policy and exposure remain advised with a failure below 99.12 opening prospective floodgates and higher rates.
DEC E-MINI S&P
Now that we’ve laid the groundwork for higher rates, we can put minor and larger-degree corrective lows and risk parameters in the S&P at 4410 and especially 4293 in better perspective. And again, we cannot conclude a critical sub-4293 failure from a minor sub-4410 failure. But understanding a number of ancillary elements helps with our game plan IF the market starts selling off in a more trendy, impulsive manner if/when it breaks 4410 and then assaults 20-Sep’s pivotal 4293 low.
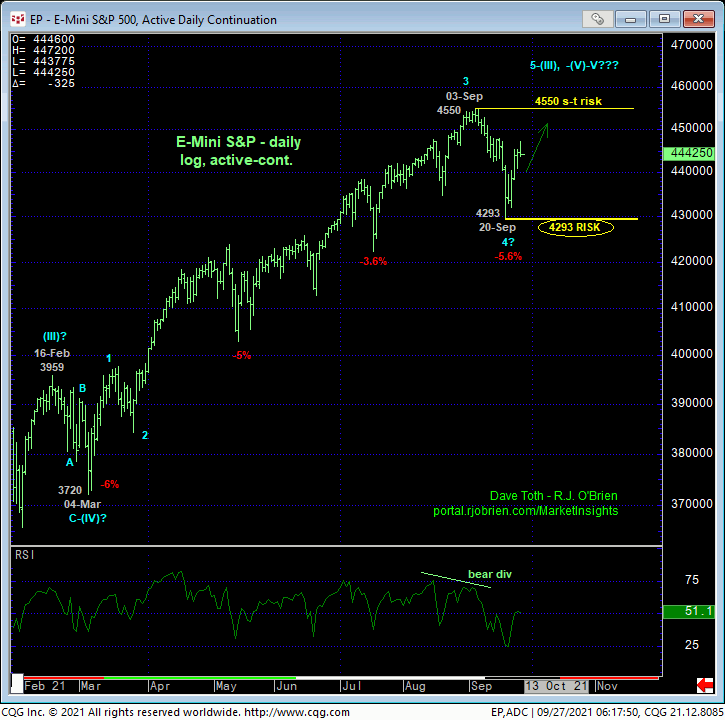
As discussed in Fri’s Technical Blog, Sep’s 5.6% drawdown was one of the more significant setbacks this year but thus far remains well within the bounds of another correction within the secular bull market. Should the market resume weakness with a break below 4293 however, and especially given some historically frothy levels of bullish sentiment/contrary opinion, the extent of the markets downside potential thereafter would have to be considered indeterminable and potentially severe, warranting neutralizing all bullish exposure by longer-term institutional players and investors.
