Posted on Apr 19, 2023, 09:43 by Dave Toth
JUN 10-Yr T-NOTES
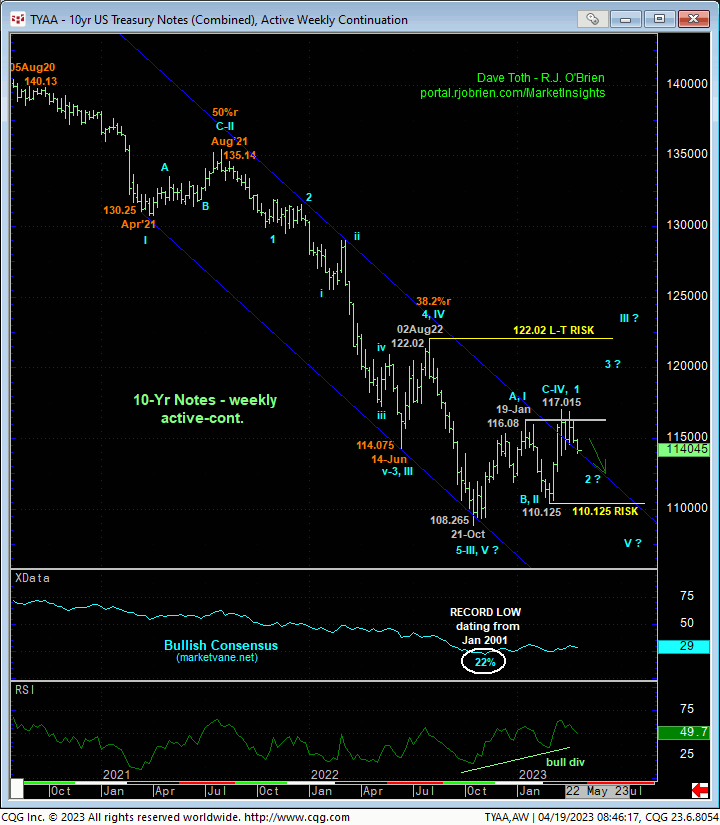
We’re beginning this Technical Blog with an update on interest rates, because if this count calling for a resumption of the secular move HIGHER in rates evolves as discussed below, it is very likely to have a negative impact on equities, the depth of which could be extensive. The 240-min chart below of the Jun T-note contract shows the market’s failure overnight below 29-Mar’s 114.07 corrective low and our short-term risk parameter. This move confirms the break of at least Mar-Apr’s uptrend, defining 06-Apr’s 116.30 high as perhaps this market’s single most important technical level. For 116.30 is THE level this market now needs to recoup to mitigate a broader bearish count and reinforce a base/reversal count that could have long-term implications that could be very supportive of equities. Until and unless such strength is proven, and especially if this relapse progresses to levels below 02-Mar’s 110.125 low, the consequences could be dramatic.
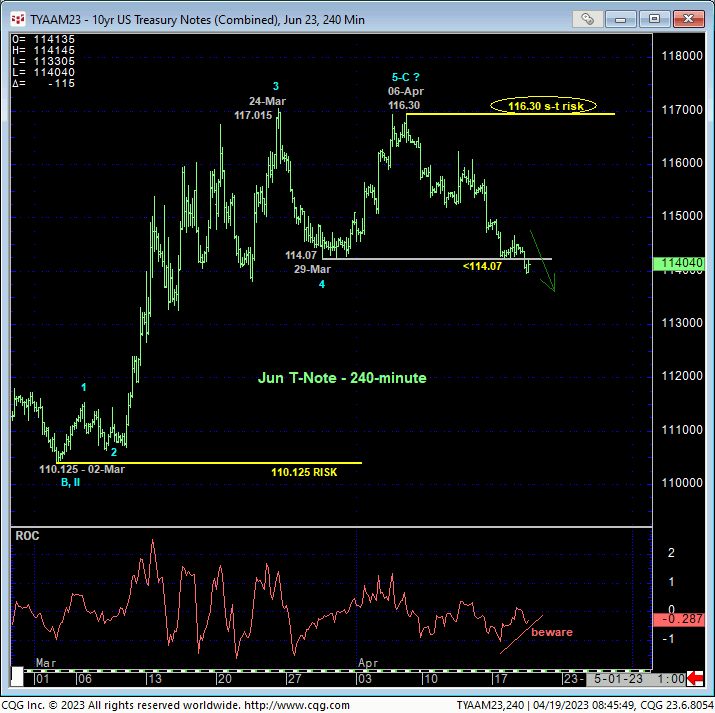
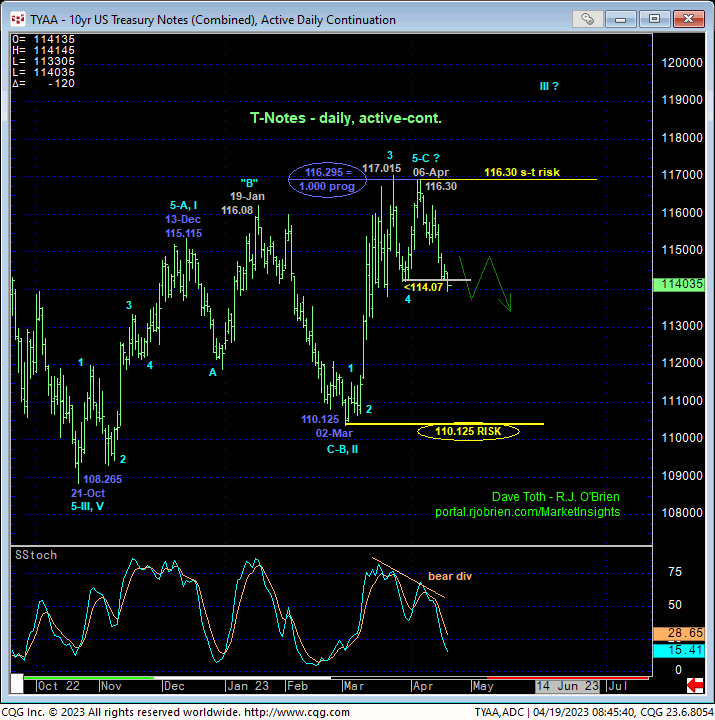
The daily chart of the contract (above) and daily log close-only chart of 10-yr yields (below) show the bearish divergence in the contract and bullish divergence in 10-yr rates that confirms the counts we introduced in 12-Apr’s Technical Blog. As a result of these momentum divergences, the entire recovery attempt from 21Oct22’s 108.265 low is “only” a 3-wave affair thus far. Left unaltered by a recovery above 116.30 and reinforced by further weakness below 02-Mar’s 110.125 low, this 3-wave recovery attempt may be considered a corrective/consolidative event that would warn of a resumption of the secular bear market that preceded it.
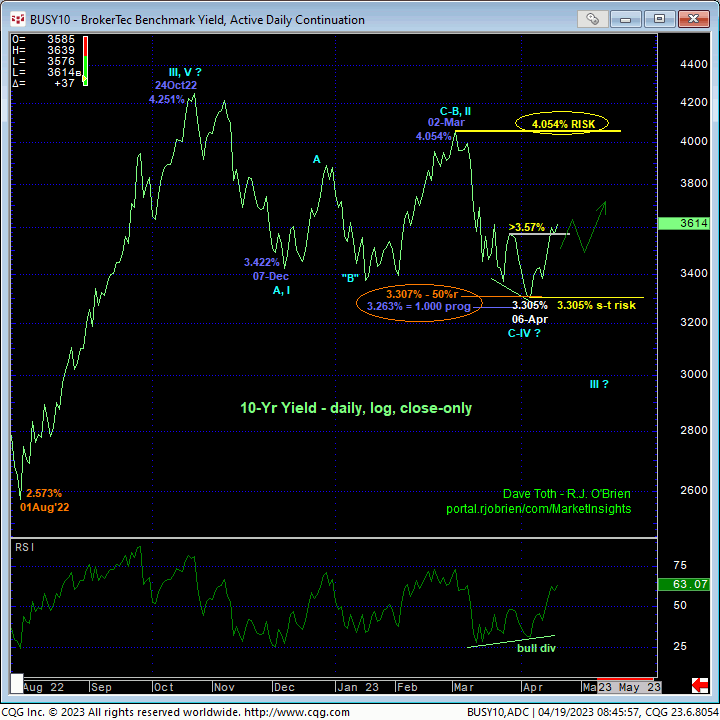
What’s interesting about this corrective/consolidative count is that on a yield basis below, 06-Apr’s 3.305% low was less than a basis point away from the 3.307% 50% retracement of Aug-Oct’22’s portion of the rate rise from 2.573% to 4.251%. Additionally, the 1.000 progression of Oct-Dec’22’s initial counter-trend drop in rates from 4.251% to 3.422%, subtracted from 02-Mar’s 4.054% high, cut across at 3.263%, just four basis points from 06-Apr’s 3.305% low. In other words, the market’s rejection of this immediate area around these Fibonacci relationships leave the entire rate relapse from last Oct’s 4.251% high to 06-Apr’s 3.305% low as a textbook example of a 3-wave correction. Left unaltered by a relapse below 3.305% needed to negate this count and resurrect a major rate-declining count, and reinforced by a recovery above 02-Mar’s 4.054% high, Oct’22 – Apr’23’s erosion in rates may be considered a corrective/consolidative structure that warns of a resumption of the secular move HIGHER in interest rates. And it’s hard to imagine such higher rates not having a profoundly negative impact on equities.
But again, all the T-Note market needs to do to negate this count is recover above 116.30 in the contract and relapse below 3.305% in rates, so our risk parameters from which to base directional exposure are specific and objective.
Finally, the weekly chart of the contract below shows the magnitude of the secular bear trend. Since early-Jan, we’ve discussed the major bullish prospect that the entire 2020 – 2022 decline is a complete and massive 5-wave Elliott sequence that would expose a major reversal higher (i.e. LOWER rates). This count certainly remains in contention. This said and per the alternate bearish count discussed above, Oct-Apr’s recovery attempt falls well within the bounds of a (4th-wave) correction against the backdrop of the secular bear trend. A relapse below 02-Mar’s 110.125 low will confirm Oct-Apr’s recovery attempt as a 3-wave and thus corrective affair, re-expose the secular bear market and resume stress on equities.
These issues considered, shorter-term traders have been advised to move to a neutral-to-cautiously-bearish policy with a recovery above 116.30 require to negate this call and warrant returning to a bullish stance. Longer-term institutional players are advised to pare bullish exposure to more conservative levels and neutralize remaining exposure on a failure below 110.125. In effect, we believe this market has identified 116.30 and 110.125 as the key directional flexion points heading forward.
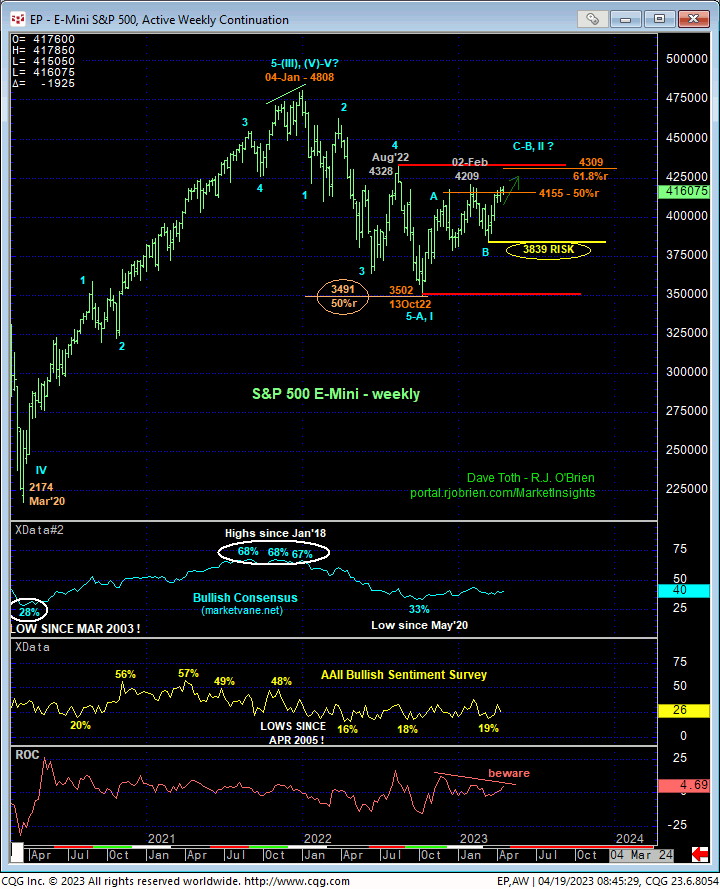
JUN E-MINI S&P 500
The 240-min chart below shows the past week’s continuation of the past month’s uptrend with the break of 04-Apr’s 4172 high confirming 06-Apr’s 4096 low as the latest smaller-degree corrective low the market must now sustain gains above to maintain a more immediate bullish count. its failure to do so will confirm a bearish divergence in momentum and break the Mar-Apr uptrend. Per such, we’re identifying 4096 as our new short-term risk parameter from which shorter-term traders can objectively rebase and manage the risk of a still-advised bullish policy and exposure.
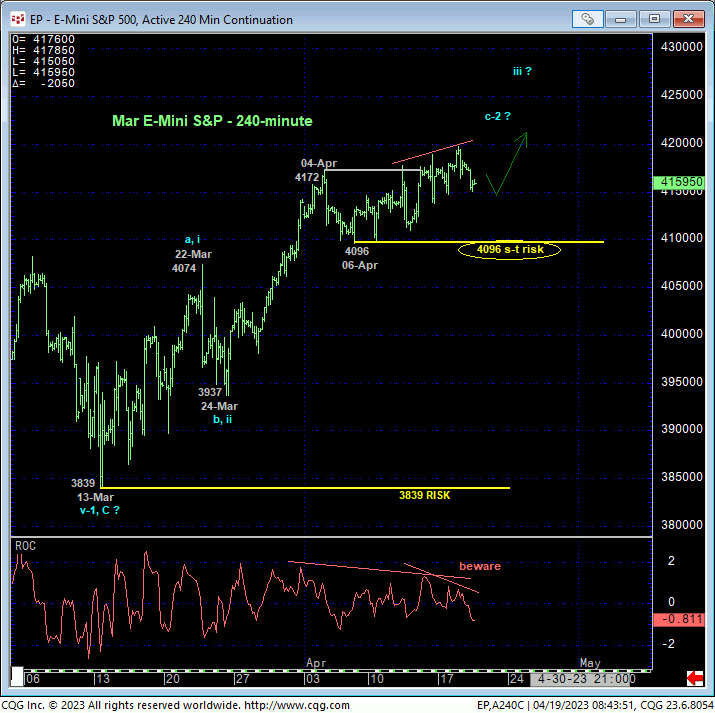
An admittedly short-term momentum failure below 4096 would only allow us to conclude the end of the uptrend from 13-Mar’s 3839 larger-degree corrective low. To break the 6-month uptrend from 13Oct22’s 3502 low, commensurately larger-degree weakness below 13-Mar’s 3839 larger-degree corrective low and key long-term bull risk parameter remains required. We cannot conclude larger-degree weakness and vulnerability from mere shorter-term weakness. However, every larger-degree momentum failure starts with a smaller-degree failure, bringing the critical issue of technical and trading SCALE into the equation.
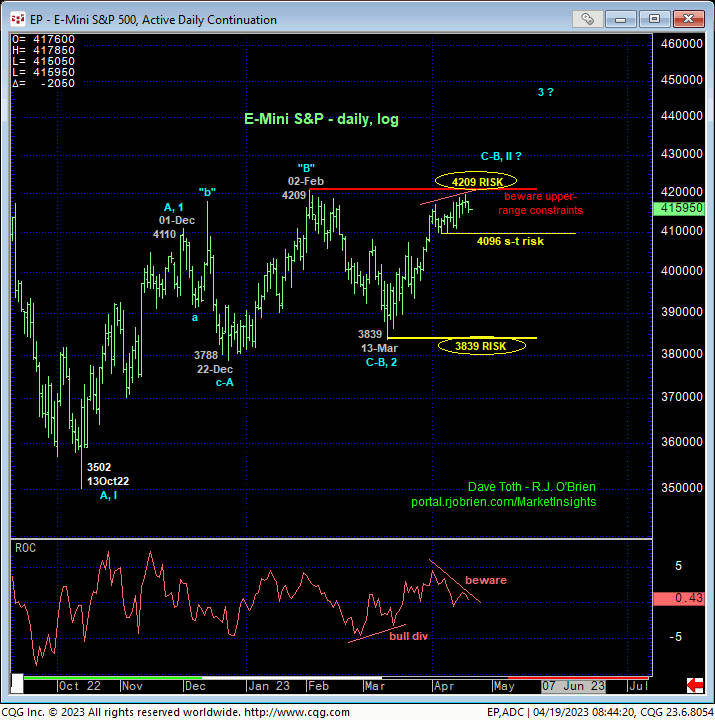
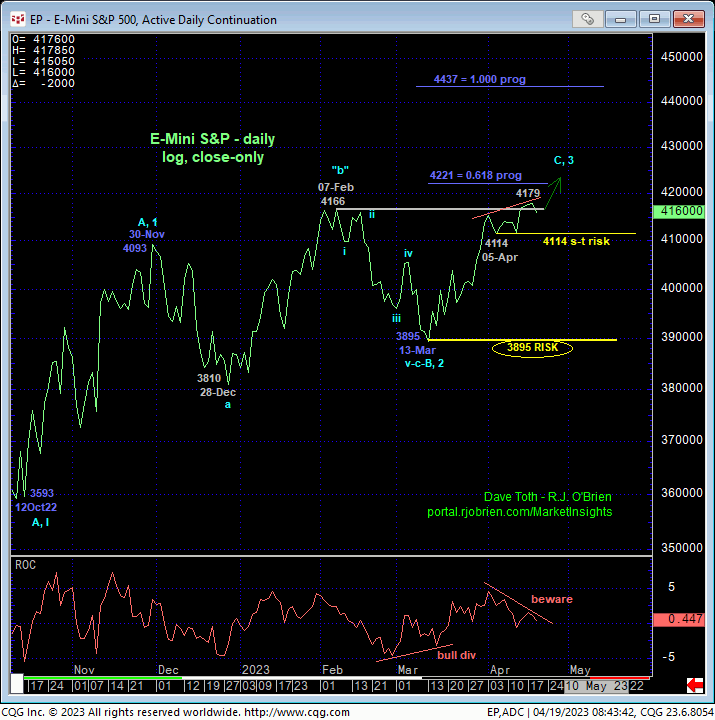
In both the daily high-low chart above and close-only chart below, waning upside momentum is clear. this means nothing until/unless a momentum failure is CONFIRMED by an intra-day slip below 4096 and/or a close below 05-Apr’s 4114 low close. However, the chart above shows the market still at the precarious upper recesses of this year’s range. Additionally, yesterday’s 4179 close establish a NEW HIGH for the rally from last Oct’s low and the highest close since last Aug. This is technically constructive, until/unless the market fails below early-Apr’s corrective lows cited above.
Lastly, on a longer-term basis, the weekly chart below shows the recovery attempt from last Oct’s 3502 low. This recovery can be one of only two things: a correction of last year’s major bear trend ahead of its eventual resumption or a reversal of last year’s bear. To this point and given the fact that this recovery has basically only retraced roughly 50% of last year’s bear, this recovery is best described as “labored” and struggling, characteristics of a correction. Waning upside momentum is clear. To confirm such a bearish count, this market needs to fail below 13-Mar’s 3839 low. To mitigate it and reinforce a broader bullish count, this market needs to BEHAVE LIKE A BULL somewhere along the line by sustaining trendy, impulsive and increasingly obvious behavior to the upside, blowing away last Aug’s 4328 high.
These issues considered, a bullish policy and exposure remain advised with a failure below 4096 required for short-term traders to move to a neutral/sideline position. Commensurately larger-degree weakness below 3839 remains required for long-term institutional players and investors to follow suit. In lieu of a relapse below at least 4096, further and possibly accelerated gains should not surprise. This said, we urge traders to acknowledge the importance of an admittedly smaller-degree corrective low and short-term risk parameter at 4096 while also keeping a keen eye on the T-Note market following today’s momentum failure below 114.07. If that relapse continues and is accompanied by an S&P failure below 4096, the ramifications could be extensive and opportunistic. We’ll certainly keep you posted in Market Insights.