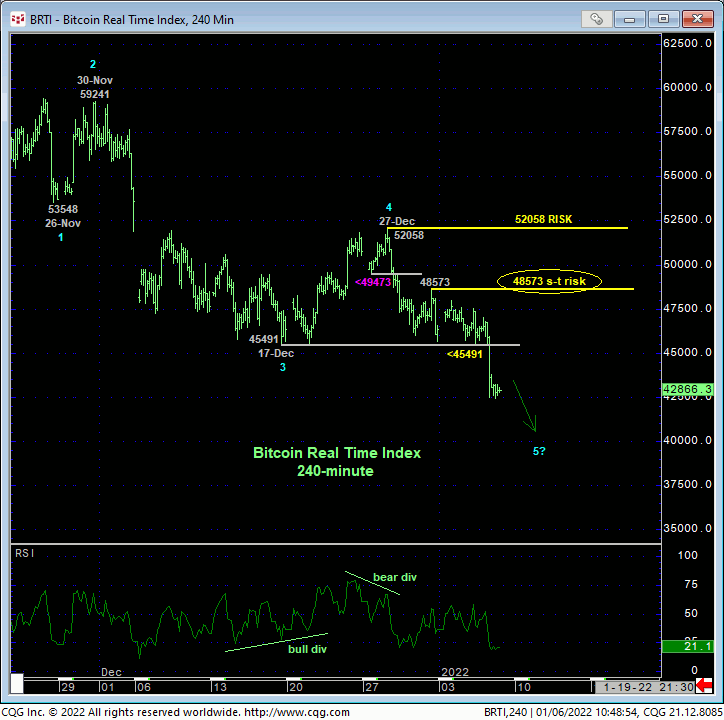
The market’s clear break yesterday below 17-Dec’s 45491 low and short-term risk parameter discussed in 27-Dec’s Technical Blog chalks up mid-to-late-Dec’s recovery attempt as another correction within our major peak/reversal count introduced in 18-Nov’s Technical Blog following that day’s bearish divergence in momentum below 58105. The 240-min chart below shows this resumed slide leaving smaller- and larger-degree corrective highs at 48573 and 52058 that this market is now required to recover above to defer or threaten a count calling for potentially severe losses in the weeks and months ahead. In this regard, these levels are now considered our new short- and longer-term risk parameters from which a bearish policy and exposure can be objectively rebased and managed.
Former 45500-area support is considered new near-term resistance ahead of further and possibly protracted losses straight away.

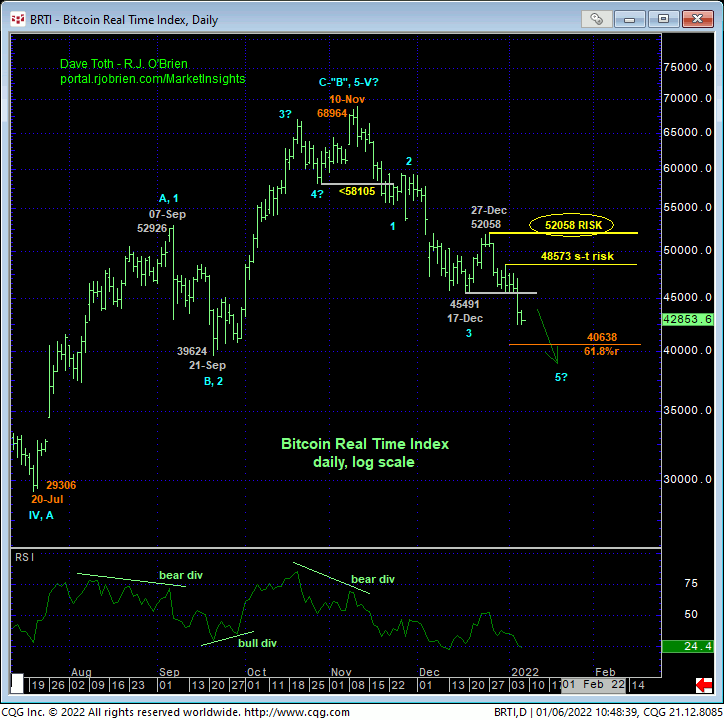
The daily log scale chart below shows yesterday’s clear continuation of the developing reversal from 10-Nov’s 68964 high and the pertinence of the recent corrective highs at 48573 and 52058 as bear risk parameters. The past couple weeks’ slide from 52058 COULD be the completing 5th-Wave of an Elliott sequence down from 10-Nov’s 68964 high that, if correct, would mean a larger-degree corrective recovery of the 2-month decline. Until and unless he market recovers above at least 48573 however and especially 52058, there’s no way to know the resumed decline from 52058 isn’t the dramatic 3rd-Wave down characterized by steep, accelerated, even relentless losses straight away.


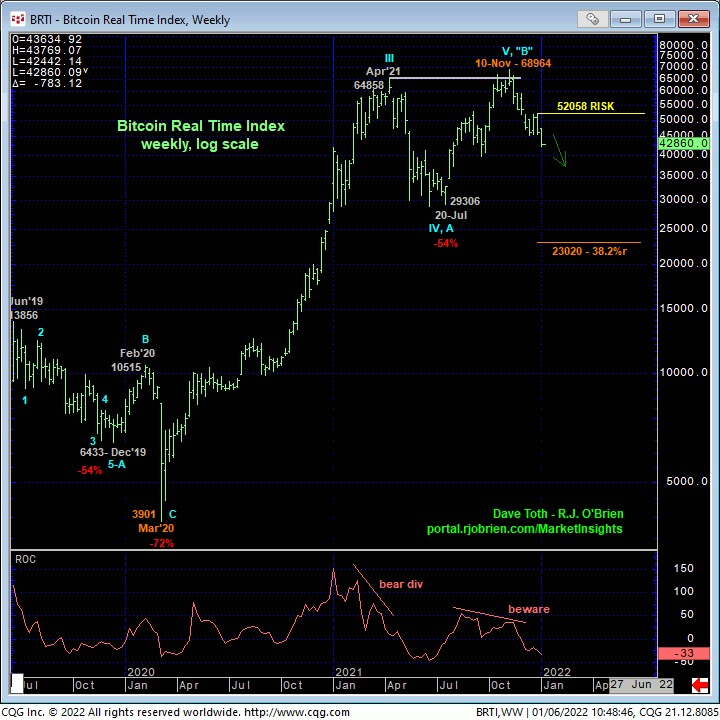
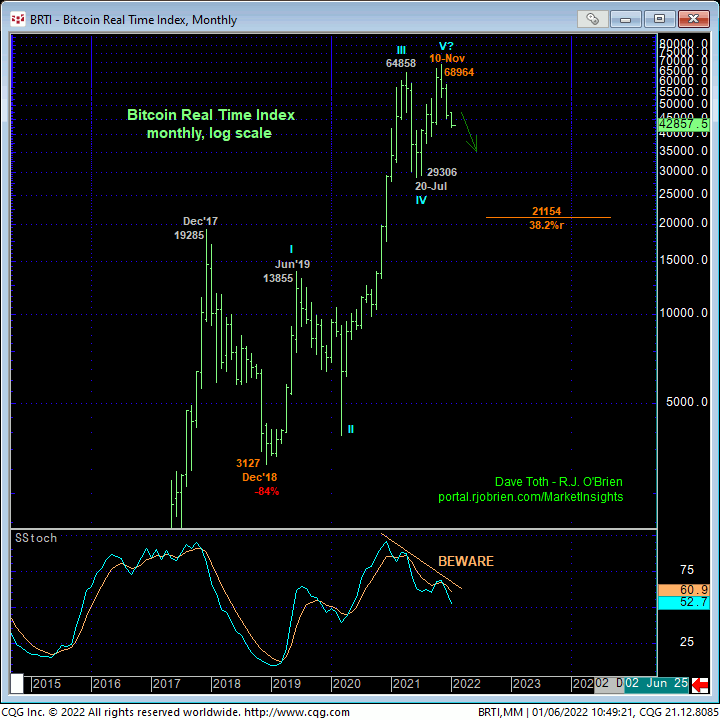
Moving out to longer-term scales, we’ve already addressed the market’s gross failure to sustain Oct-Nov’s break ABOVE Apr’21’s 64858 previous all-time high that, combined with 18-Nov’s momentum failure, provided the early elements of a broader peak/reversal threat. Even more frightening to bulls but opportunistic for bears is the prospect labeled in the monthly log chart below that suggests Jul-Nov’s rally from 29306 to 68964 is the completing 5th-Wave of a massive Elliott Wave sequence from Dec’18’s 3127 low. Amidst upside momentum that’s been waning since 3Q21, such a count would warn of a multi-quarter correction or reversal where even a Fibonacci minimum 38.2% retrace of the 3-year rally from 3127 to 68964 doesn’t cut across until the 21000-area.
These issues considered, a bearish policy and exposure remain advised for long-term institutional players with a recovery above 48573 required to pare exposure to more conservative levels and further strength above 52058 required to jettison remaining exposure altogether. Shorter-term traders with tighter risk profiles whipsawed out of bearish exposure on 27-Dec’s bullish divergence in short-term mo are advised to return to a bearish policy and first approach to 45000OB as a corrective re-selling opportunity with a recovery above 48573 required to negate this specific call and warrant its cover. In lieu of strength above at least 48573 and preferably above 52058, the trend remains down on all practical scales and should not surprise by its continuance or acceleration straight away.


