Posted on Sep 19, 2022, 07:04 by Dave Toth
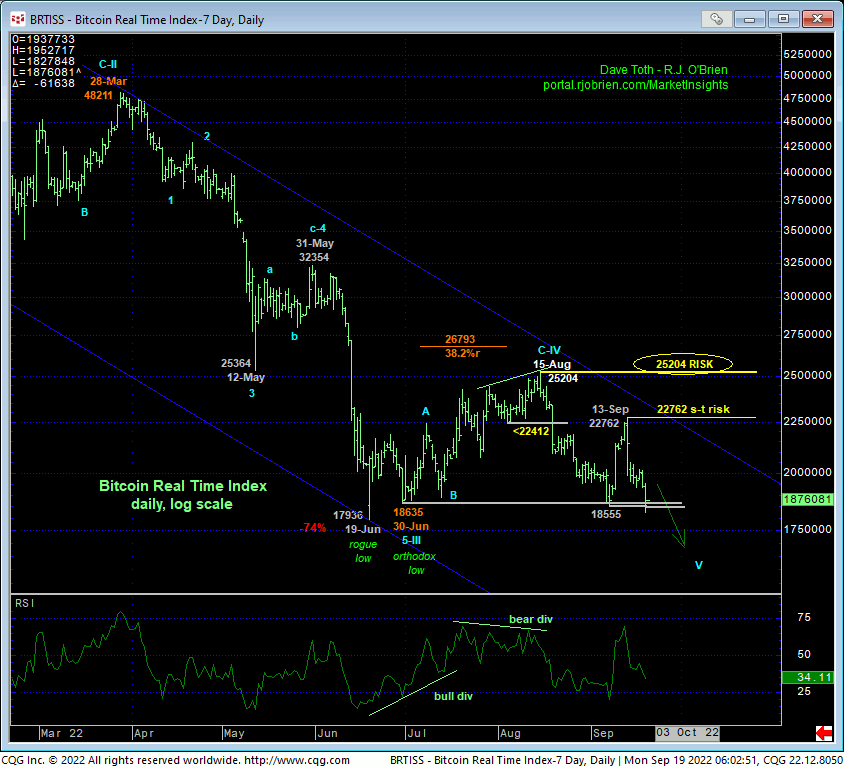
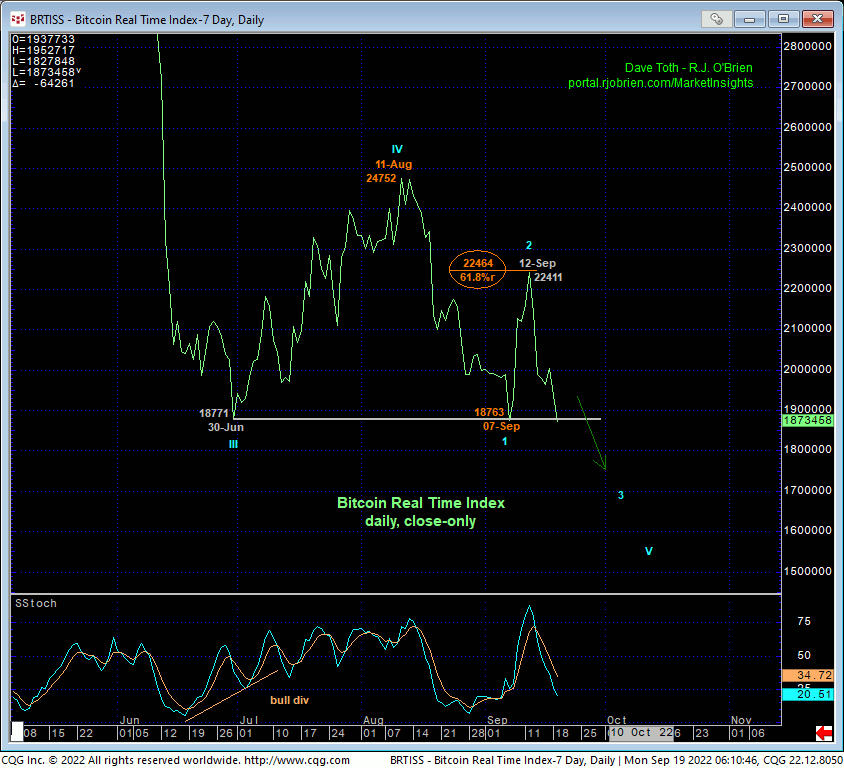
Overnight’s break below early-Sep’s 18555 low and, most importantly, 30-Jun’s 18635 orthodox low reinstates the secular bear trend and confirms our resumed bearish count introduced in 19-Aug’s Technical Blog following that day’s bearish divergence in momentum below 22412 that rendered Jun-Aug’s recovery attempt another 3-wave and thus corrective affair. After an exact 61.8% retrace of Aug-Sep’s 24752 – 18763 decline on a daily close-only basis below, this resumed weakness leaves smaller- and larger-degree corrective highs in its wake at 22762 and 25204 that serve as our new short- and long-term parameters from which the risk of a still-advised bearish policy and exposure can be objectively rebased and managed commensurate with one’s personal risk profile.
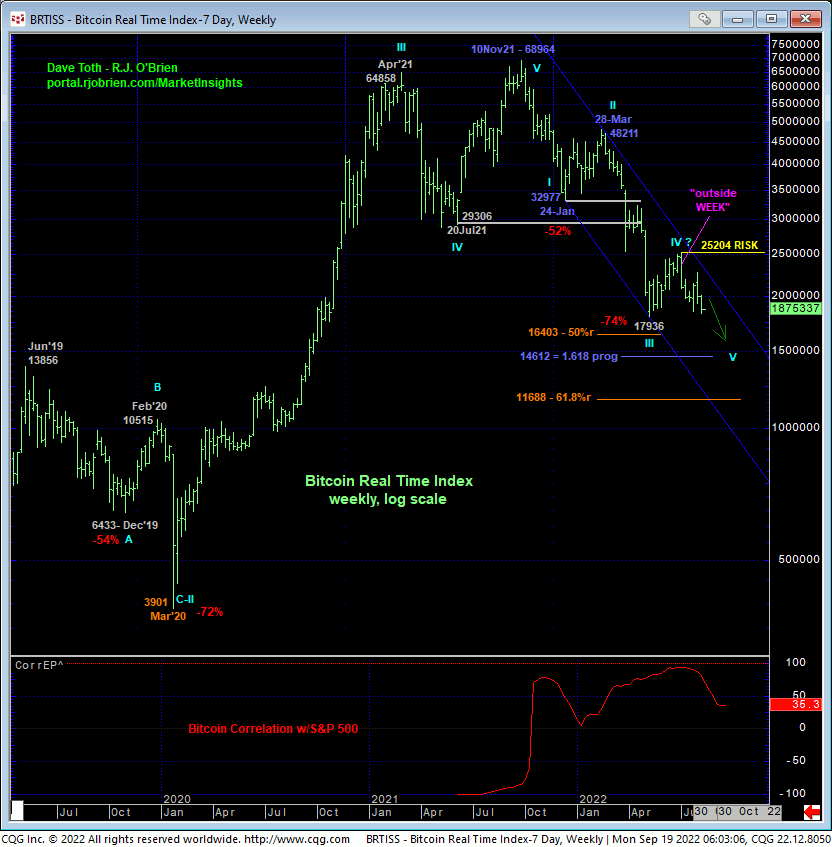
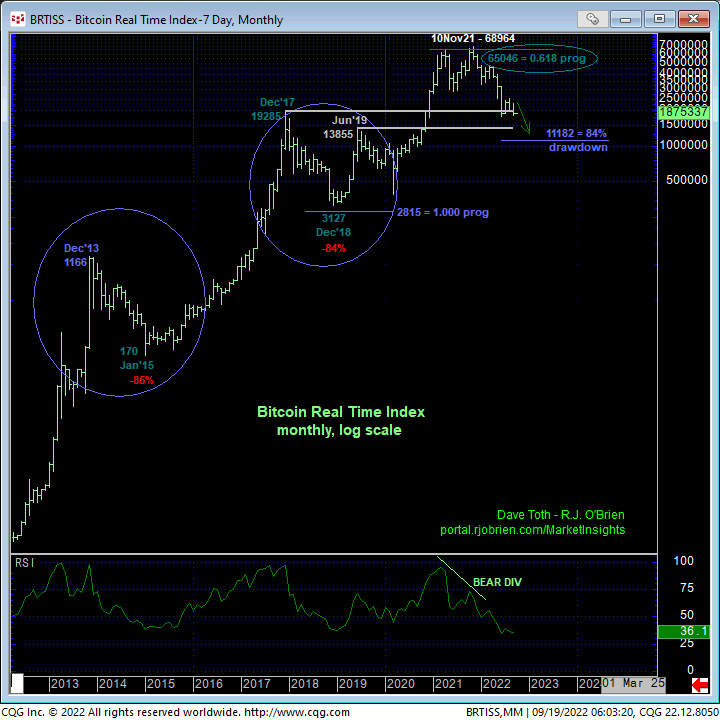
As for the market’s remaining downside potential, it remains as indeterminable and potentially severe as it was following previous momentum failures and resumptions of the major downtrend in Nov/Dec’21 and May’22. Forecasts and prognostications are rarely worth the paper they’re written on. For most of this year, we’ve cited merely derived Fibonacci progression and retracement relationships ranging from the 23000-area to 11000. We’ve also noted that each of the past two major corrections in 2018 and 2013-2015 spanned an almost identical 84% and 85%, respectively. A repeat of such a correction or reversal projects to the 11182-area. Former 2017 and 2019 highs/resistance-turned-support range from 19285-to-13855.
Like trend lines, Bollinger Bands, imokus, the ever-useless moving averages and even the vaunted Fibonacci relationships we cite often in our analysis, NONE of these merely derived and so-called “technical levels” matter one bit in the absence of an accompanying confirmed bullish divergence in momentum needed to arrest the clear and present and major bear trend. Herein lies the importance of identifying the recent corrective highs and risk parameters specified above. This market could bottom tomorrow. Or this bear could continue for months or quarters and blow away even the deepest of the levels listed above. The only levels that matter currently are 13-Sep’s 22762 smaller-degree corrective high and especially 15-Aug’s 25205 larger-degree corrective high. Until and unless these markets are recouped, the trend is down on all scales and should hardly surprise by its continuance or acceleration. To speculate that this market will bottom at ANY level below current prices is a totally subjective, baseless and/or emotional hope. And as we’ve often stated, hope is not an investment strategy.
These issues considered, a bearish policy and exposure remain advised with a recovery above 22762 require for shorter-term traders to move to the sidelines and for longer-term institutional players and investors to pare exposure to more conservative levels. In lieu of such strength, further and possibly accelerated losses remain expected.