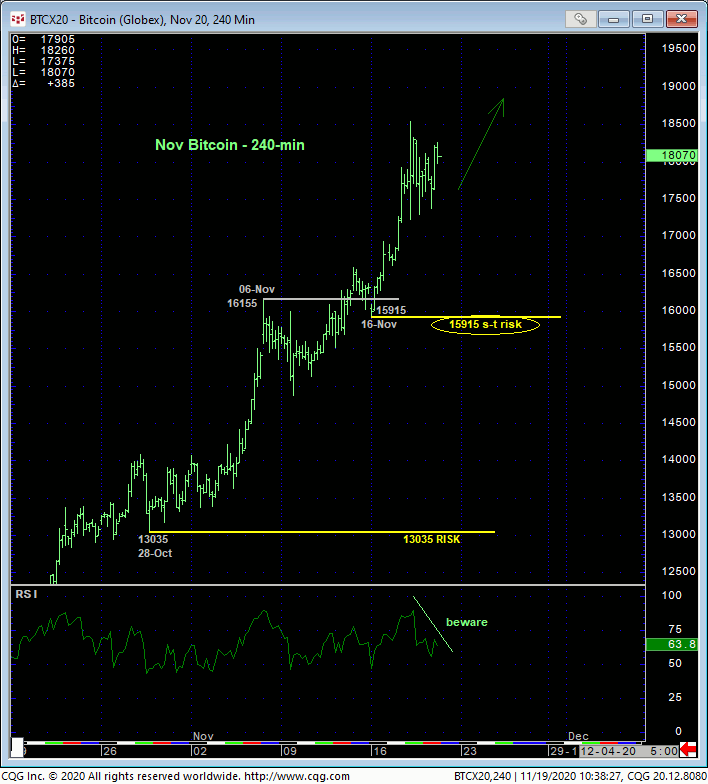
Especially in light of peak/reversal behavior in Treasuries, multi-year range-bound currencies, developing PEAK/reversal threat behavior in gold, a re-flourishing pandemic globally and the recent U.S. presidential race and fallout, the sustained major uptrend in bitcoin has been nothing short of phenomenal. This week’s continued stratospheric rise (+16%) from even Mon’s 15915 low leaves this low as the latest smaller-degree corrective low the market s minimally required to fail below to even defer, let alone threaten the bull. Per such, this 15915 level is considered our new short-term risk parameter from which a still-advised bullish policy and exposure can be objectively rebased and managed by shorter-term traders with tighter risk profiles. Until at least such sub-15915 weakness is shown, further and possibly accelerated gains remain expected.


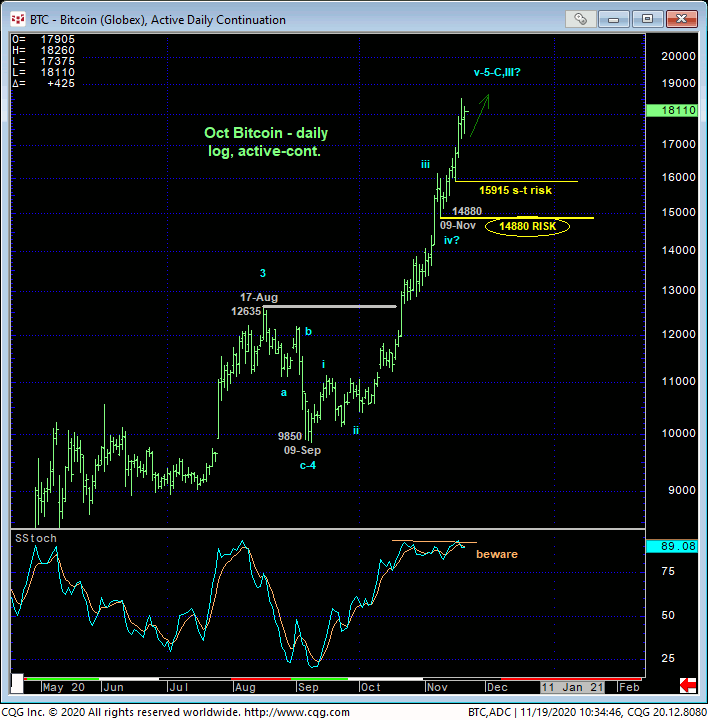
Only a glance at the daily (above) and weekly (below) log scale charts is needed to see that the trend is up on all scales and should not surprise by its continuance or acceleration. On this broader scale, 09-Nov’s 14880 next larger-degree corrective low remains intact as our key longer-term risk parameter to a still-advised bullish policy for long-term players.
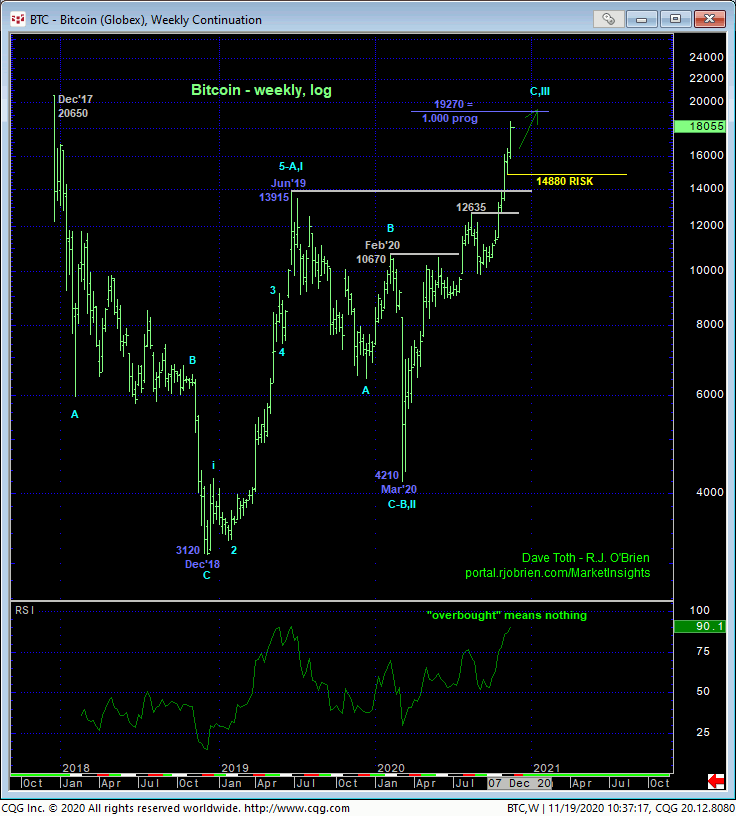
The weekly log scale chart below shows the market’s encroachment on the (19270) 1.000 progression of Dec’18 – Jun’19’s 3120 – 13915 rally from Mar’20’s 4210 corrective low. Readers of our blog know of our disdain for merely “derived” levels like trend lines, Bollinger Bands, imokus, the ever-useless moving averages and even the vaunted Fibonacci relationships we cite often in our analysis. Such levels NEVER have proven to be reliable reasons to buck a clear and present trend in the absence of an accompanying bearish (in this case) divergence in momentum- and they never will- as the derived level “tail” never, ever wags the underlying market “dog”. Herein lies the importance of the corrective lows and risk parameters discussed above.
The same thing holds for ever referring to a market as “overbought” (or “oversold”). The RSI in the weekly chart below is currently at 90%. This means absolutely nothing and is NOT a reason to believe this bull doesn’t have miles to go until and unless the market PRVES weakness below corrective lows like 14880 and even 15915. In effect, the ONLY technical levels of any merit currently are those BELOW the market in the form of former resistance-turned-support and corrective lows.

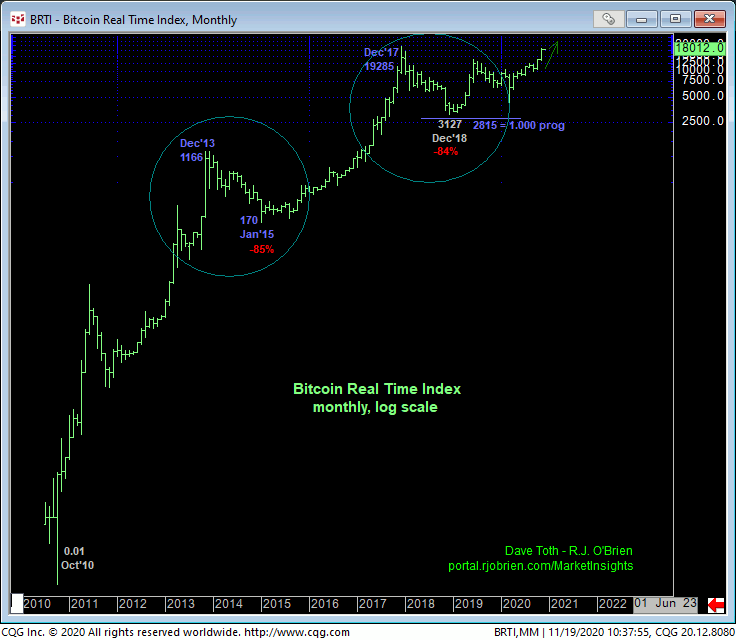
Finally, the monthly log scale chart of the Bitcoin Real Time Index below shows the market on the cusp of reaffirming the secular bull market after Dec’17 – Dec’18’s (84%) correction that was virtually identical in scope to the (85%) correction from Dec’13’s 1166 high to Jan’15’s 170 low. A break above Dec’17’s 19285 high in this Index and above Dec’17’s 20650 high in the futures contract is fully expected. The market’s upside potential is totally indeterminable and potentially extreme and should not be underestimated. The only thing that matters at this point is MOMENTUM and the market’s ability to sustain gains above prior corrective lows.
In sum, a full and aggressive bullish policy and exposure remain advised with a failure below at least 15915 required to defer or threaten the bull enough to warrant paring or neutralizing exposure. In lieu of such weakness, further and possibly accelerated gains remain expected.


