DEC GOLD
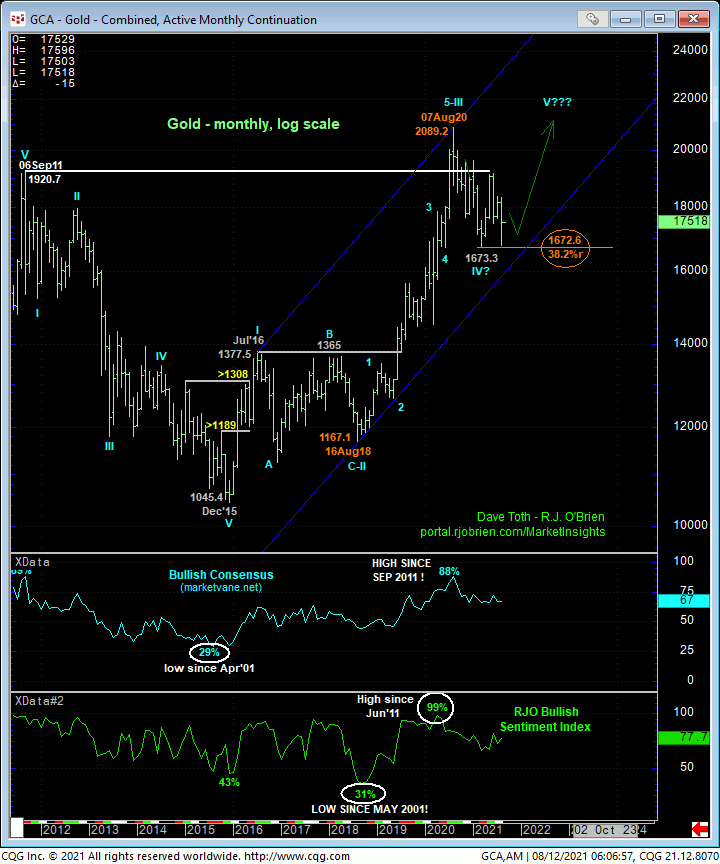
Since mid-Apr’s bullish divergence in momentum exposed 08-Mar’s 1673.3 low as the end of a 3-wave decline from Aug’20’s 2089 all-time high, we’ve been of the opinion that that low completed or defined the lower boundary to a major correction within the secular bull market ahead of an eventual resumption of the bull to 2089+ levels. Such a bull market correction count is easy to see in the monthly log chart below where Aug’18 – Aug’20’s massive 79% rally from 1167 to 2089 is a dominant and likely 3rd-Wave portion of an eventual 5-wave sequence up from Dec’15’s 1045 low. The fact, thus far at least, that the sell-off attempt from last year’s high has only retraced a Fibonacci minimum 38.2% of this 1167 – 2089 suspected 3rd-Wave arguably underscores the long-term strength of this bull and the likelihood that the past year’s setback is indeed corrective/consolidative rather than that of a major reversal.
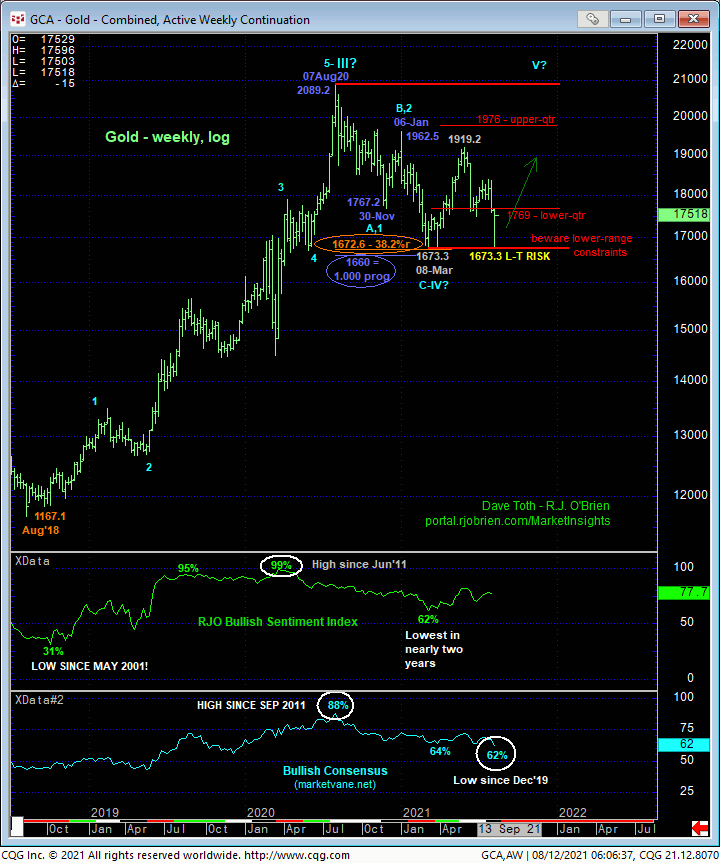
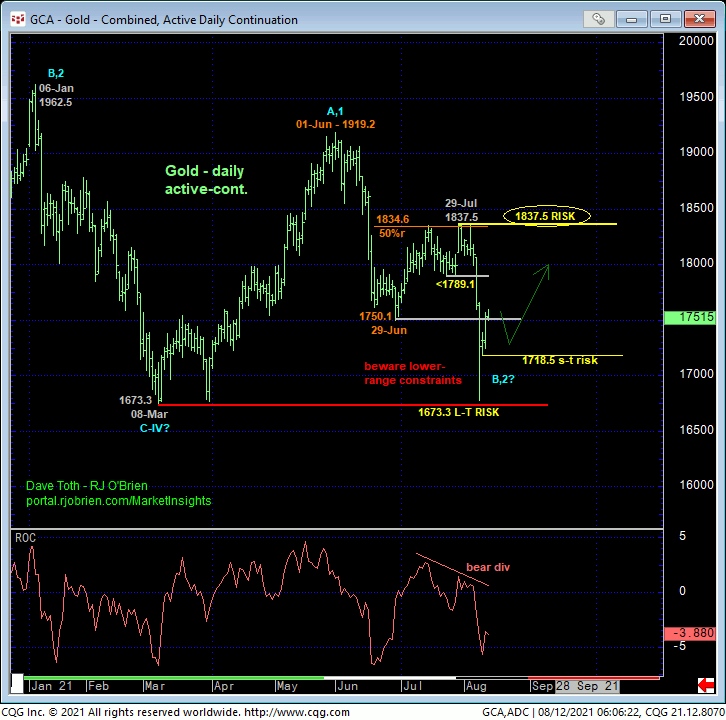
The weekly log chart above and daily chart below show the past week’s relapse to the lower-quarter of the past year’s range where we are always on the lookout for a bullish divergence in momentum needed to arrest the slide that, combined with the range’s lower-quarter support, presents an acute risk/reward opportunity from the bull side. On a broader scale, 29-Jul’s 1837.5 larger-degree corrective high remains intact as our key risk parameter this market needs to recoup to confirm the past couple months’ relapse from 01-Jun’s 1919.2 high as a 3-wave and thus corrective structure that would reinforce our long-term bullish count to eventual 2089+ levels. Back in the middle of the broader lateral range however, the risk/reward merits of making directional decisions are impractical and poor. Herein lies the importance of trying to identify a more reliable low and support “down here” from which non-bearish decisions like short-covers and bullish punts can not only be objectively based and managed, but also present an extraordinary and compelling opportunity.
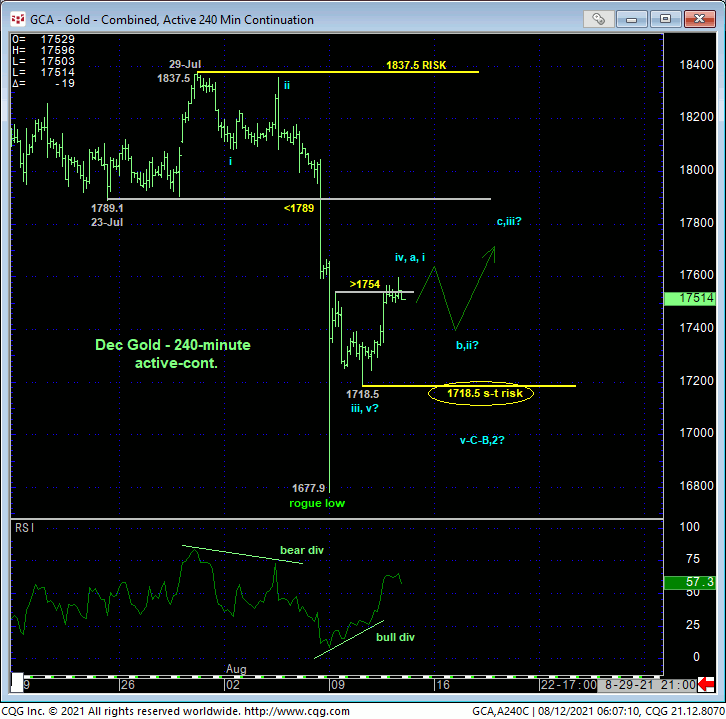
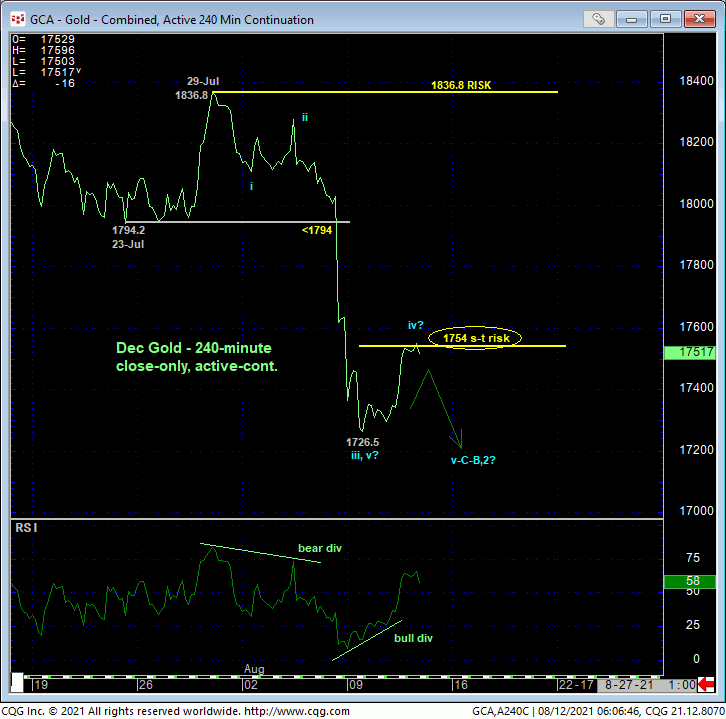
Drilling down even further to an intra-day basis, the 240-min chart above shows yesterday and overnight’s recovery above a minor corrective high at 1754 from Mon confirming a bullish divergence in short-term momentum. Ignoring Mon’s intra-day low at 1677.9 as a rogue event with little or no technical relevance, we believe this short-term mo failure defines Tue’s 1718.5 low as one of developing importance and a short-term but objective risk parameter from which non-bearish decisions like short-covers and bullish punts can be objectively based and managed. A caveat however is that that low might have only completed the 3rd-Wave down from 29-Jul’s 1837.5 high, suggesting the past couple days’ pop might only be an interim corrective 4th-Wave ahead of a final 5th-Wave relapse to new lows below 1718.5. Such a count looks a little more viable on a 240-min close-only basis below.
To navigate this debate, we suggest applying our three reversal requirements test to this prospective bottom:
- a confirmed bullish divergence in momentum (CHECK)
- proof of trendy, 5-wave behavior up in the initial counter-trend recovery (CHECK)
- proof of labored, 3-wave corrective behavior on a subsequent relapse attempt that is stemmed by another bullish divergence in short-term mo at a level above the suspected low at 1718.5 (NOT YET).
As compelling as it might be to get some longs on “down here” ahead of an eventual resumption of the secular bull that would be a $350+ move, bulls are advised to be patient and wait for/require better basing/reversal-threat behavior before jumping in. Nonetheless and for the reasons detailed above, we believe the risk/reward merits of any bearish policy and exposure down here have become quite questionable, warranting a move to a neutral/sideline position for the time being. We will, of course, update developments if/when we believe the market has more properly identified a low and support from which a bullish play can be objectively entered and managed. Stay tuned.
SEP SILVER
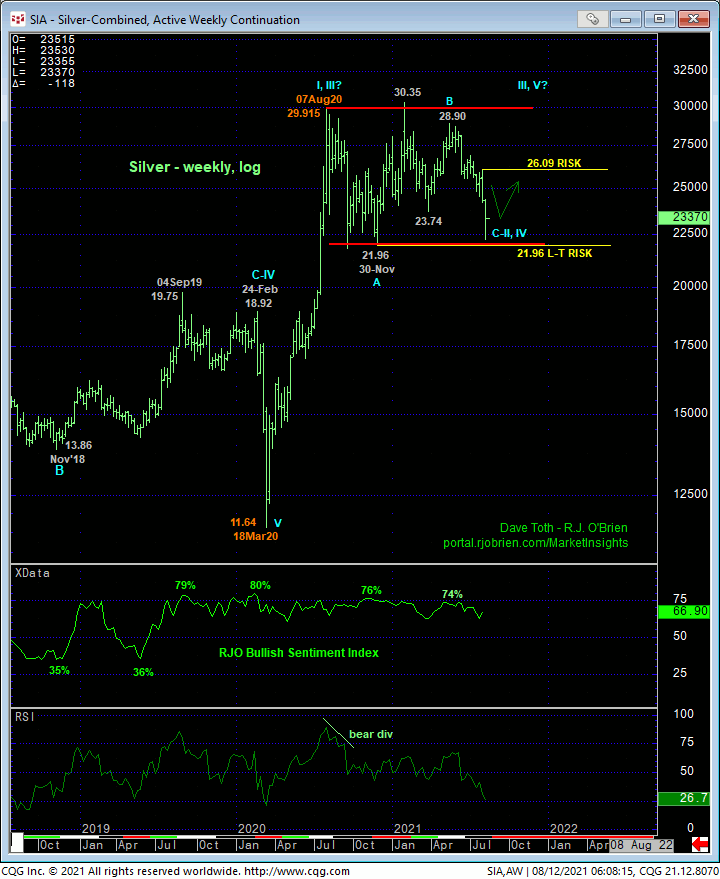
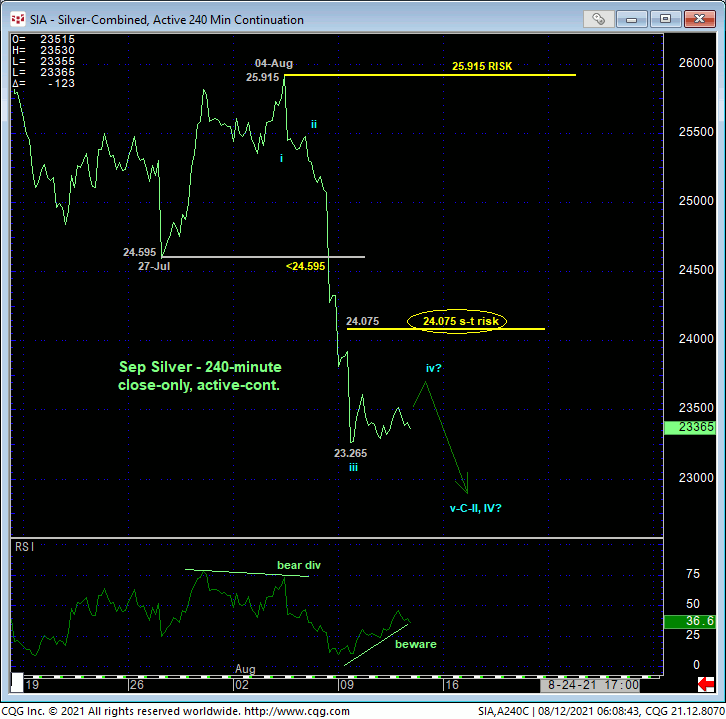
The technical construct and expectations for silver are identical to those detailed above in gold given this market’s relapse to the lower-quarter of its past year’s range between 29.915 and 21.96.
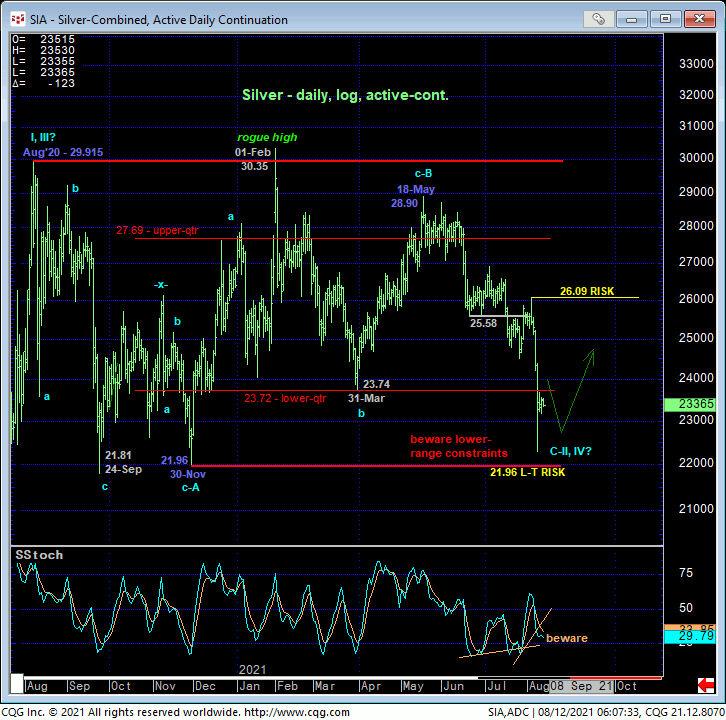
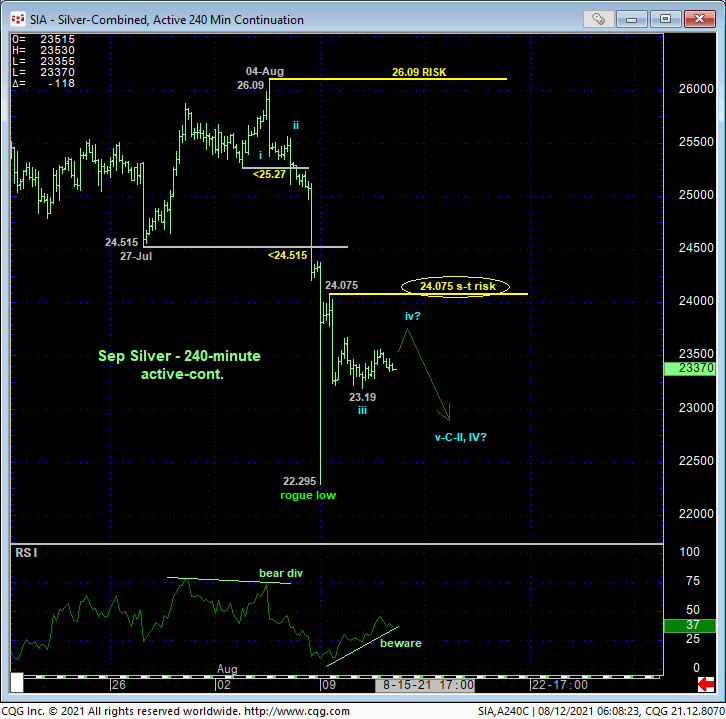
Unlike gold, and on either a bar chart or close-only basis, silver has yet to confirm a bullish divergence in short-term momentum needed to arrest not only the past week’s slide, but a downtrend that dates from 18-May’s 28.90 high. Per such and at the very least, such a confirmed bullish divergence in short-term momentum above at least Tue’s 24.075 minor corrective high remains required to reject/define a more reliable low and support that might have completed the decline. In lieu of such, further lateral-to-lower prices remain expected. But here too, beware what could be an extraordinary risk/reward opportunity from the bull side in the week or so ahead.
