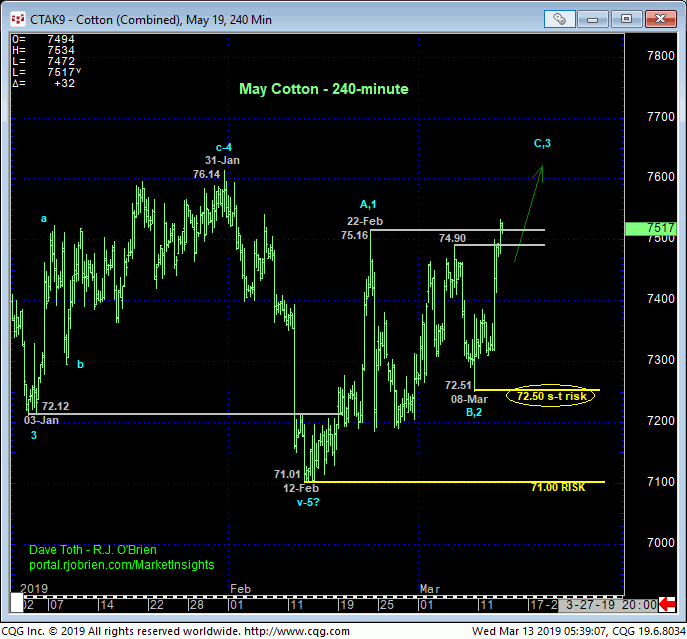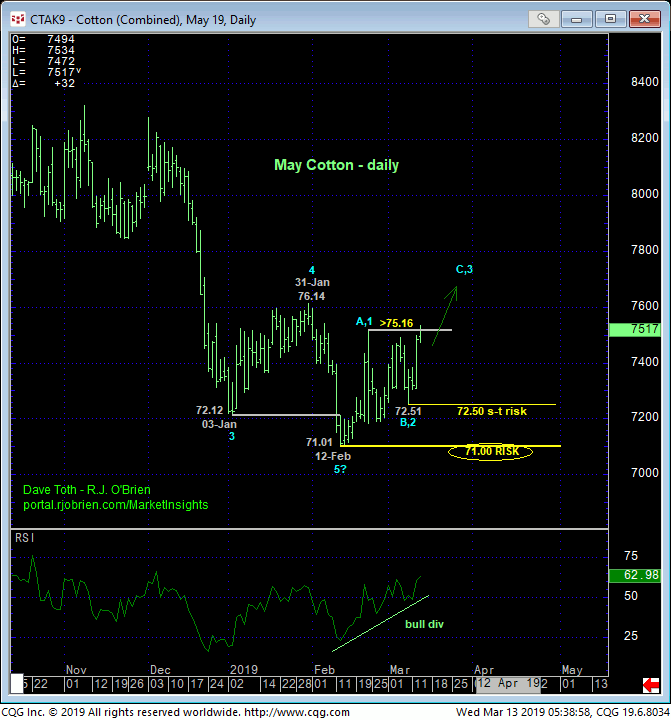
Overnight’s break above both 06-Mar’s 74.90 high and 22-Feb’s 75.16 high confirms at least the intermediate-term trend as up. The important by-product of this fact is the market’s definition of Fri’s 72.51 low and 12-Feb’s 71.01 low as corrective lows the market is now required to fail below to threaten or negate not only this developing uptrend, but a broader base/reversal environment that could be major in scope. Per such traders are advised to move to a new bullish policy and exposure with 72.50 and 71.00 considered our new short- and long-term parameters from which to base and manage the risk of bullish exposure.


The developing prospect of a broader base/reversal-threat environment is predicated on the following technical facts and observations:
- the bullish divergence in momentum resulting from overnight’s break above 22-Feb’s 75.16 initial counter-trend high
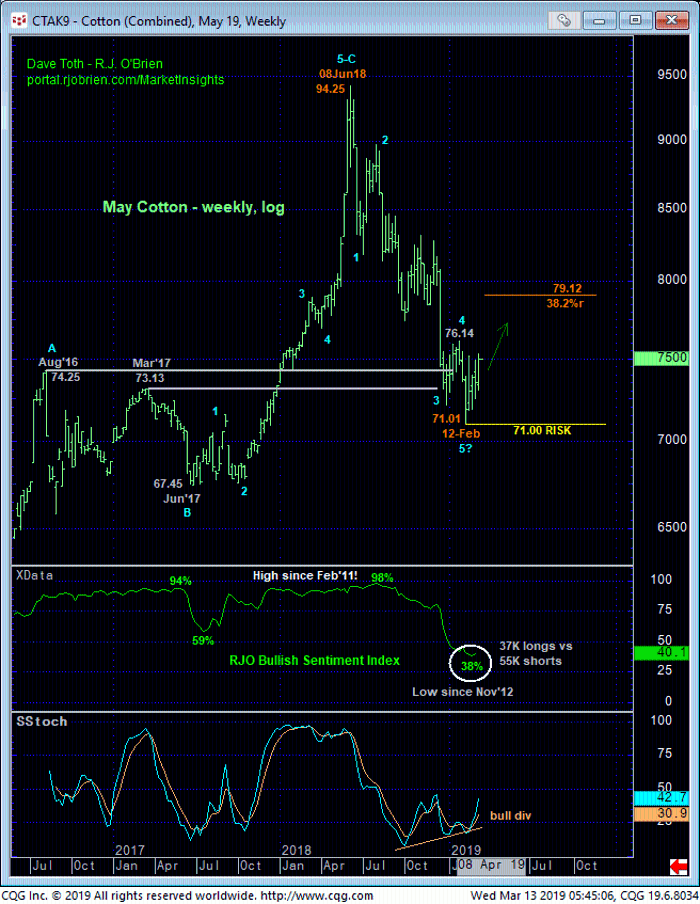
- the recent 38% reading in our RJO Bullish Sentiment Index; its lowest, most bearish reading in over SIX YEARS, and
- the prospect that the decline from 08Jun18’s 94.25 high is a complete 5-wave Elliott sequence as labeled in the weekly log chart below.
The Elliott “observation” aside, the combination of a confirmed bullish divergence in momentum amidst historically bearish sentiment is a pivotal one and one that typifies virtually al major base/reversal environments. It’s important because the market has now defined more reliable lows and support to the blood-letting that has spanned eight months. These specific lows can now be used as risk parameters from which a new bullish policy can be objectively based and managed.
Might the arguably labored recovery attempt from 12-Feb’s 71.01 low be a repeat of Jan’s labored, corrective recovery attempt before a resumption of the major downtrend? Sure. Absolutely. Because the market hasn’t yet provided that dramatic 3rd-wave-up that would obviously settle the issue. And if this alternate bearish count is correct, all the market has to do is resurrect weakness starting with a relapse at least 72.50 and preferably below 71.00. Until and unless such weakness s proven, the facts cited above warn of increased odds of a reversal higher that could be extensive. Indeed, even a Fibonacci minimum 38.2% retrace of Jun’18 – Feb’19’s 94.25 – 71.01-decline doesn’t cut across until 79.12. And given an 8-month decline, even a relatively minor correction could span three months.

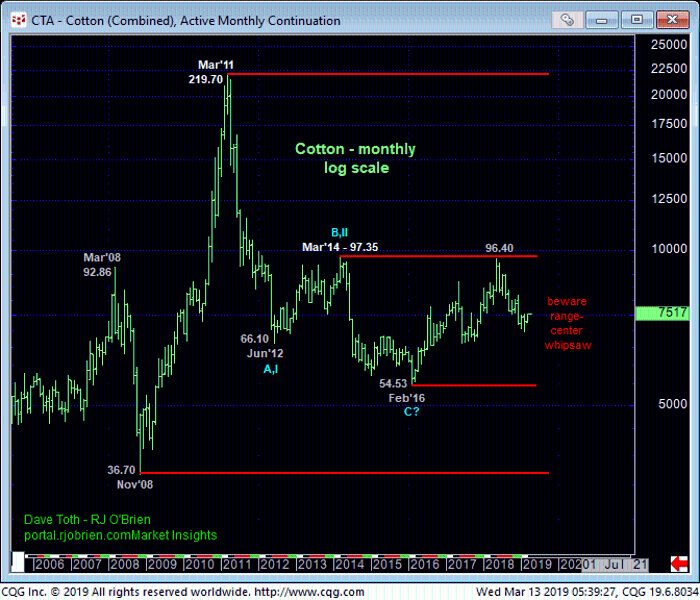
Finally, on an even longer-term basis, the monthly log active-continuation chart below shows the market pretty much smack in the middle of the past 7-YEAR range where the odds of aimless whipsaw risk on this gigantic scale should be considered higher. We believe this warrants a more conservative approach to risk assumption that places emphasis on tighter but objective risk parameters like we’ve identified above.
These issues considered, traders are advised to neutralize all bearish exposure if they haven’t done so already and move to a cautious bullish stance by first approaching setback attempts to the 74.50-to-74.25-range as corrective buying opportunities with a failure below 72.50 required to threaten this call enough to warrant its cover. In lieu of at least sub-72.50 weakness, further and possibly protracted gains should not surprise in the weeks ahead.


