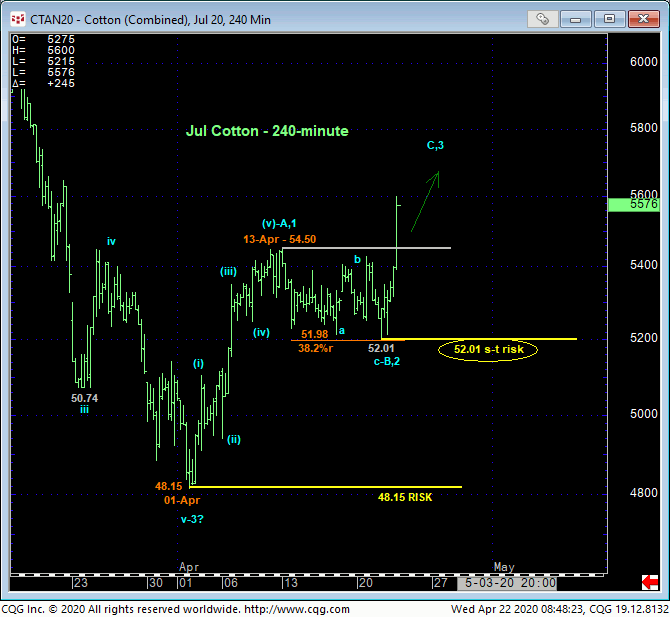
In 06-Apr’s Technical Blog following that day’s bullish divergence in short-term momentum that at least temporarily stemmed the major downtrend, we discussed the importance of technical and trading SCALE in navigating the usual correction-vs-reversal dilemma. After an initial trendy, impulsive 5-wave rally from 01-Apr’s 48.15 low to 13-Apr’s 54.50 high, today’s bust-out above that 54.50 initial counter-trend high confirms the subsequent 38.2% retrace and sell-off attempt to yesterday’s 52.01 low as a 3-wave and thus corrective structure within a broader base/reversal environment.
Today’s resumed strength clearly leaves yesterday’s 52.01 low as the latest smaller-degree corrective low and 01-Apr’s 48.15 low as the two key levels and risk parameters the market is now required to fail below to threaten and then negate a new bullish policy. Former 54.50-area resistance is considered new near-term support ahead of further and possibly protracted gains straight away.


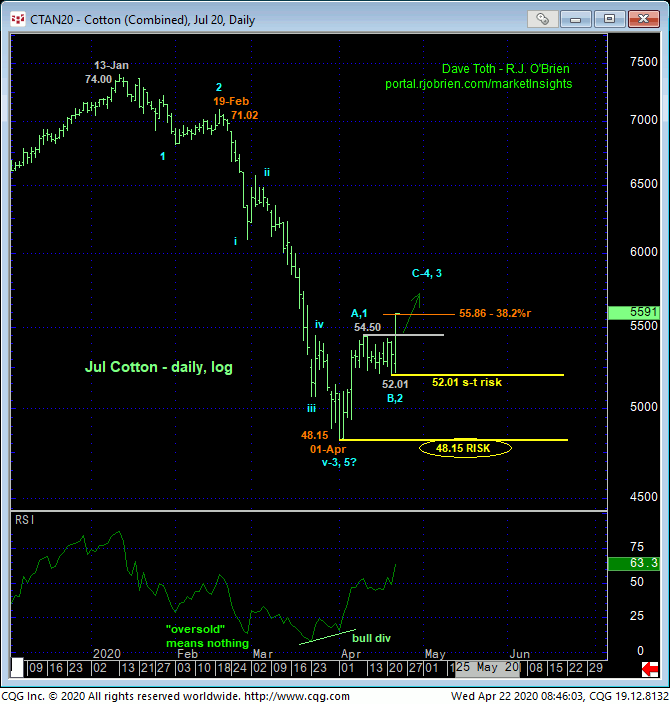
In the daily log scale chart above, we simply don’t know if Jan-Apr’s plunge is a complete 5-wave structure or if it is only 3-waves, suggesting this month’s recovery may only be a 4th-Wave correction ahead of a resumption of the secular bear. Indeed, the market has thus far only retraced a Fibonacci minimum 38.2% of the prospective 3rd-Wave decline from 19-Feb’s 71.02 high to 01-Apr’s 48.15 low. But we know with certainty and specificity that PROOF of resumed weakness below at least 51.02 is now required to threaten a broader bullish count and resurrect a bearish one. Until and unless such sub-52.01 weakness is shown, there’s no way to know that the rally from yesterday’s 52.01 low isn’t the dramatic 3rd-Wave of a major reversal higher that warns of protracted, even relentless gains straight away.
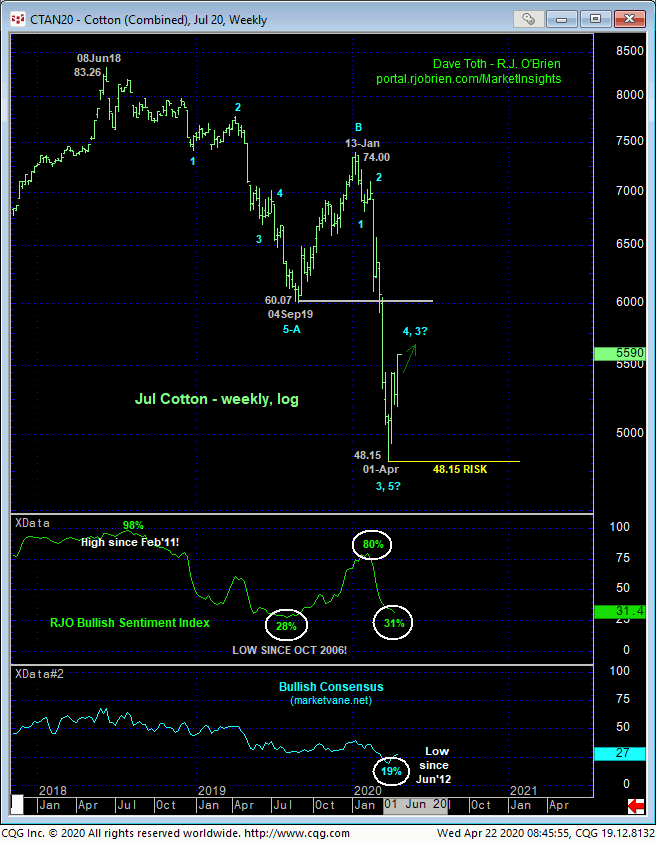
Historically bearish sentiment/contrary opinion levels shown in the weekly log chart below totally reinforce a base/reversal count that could be major in scope since Jan-Apr’s major downtrend has been broken, rendering sentiment applicable.

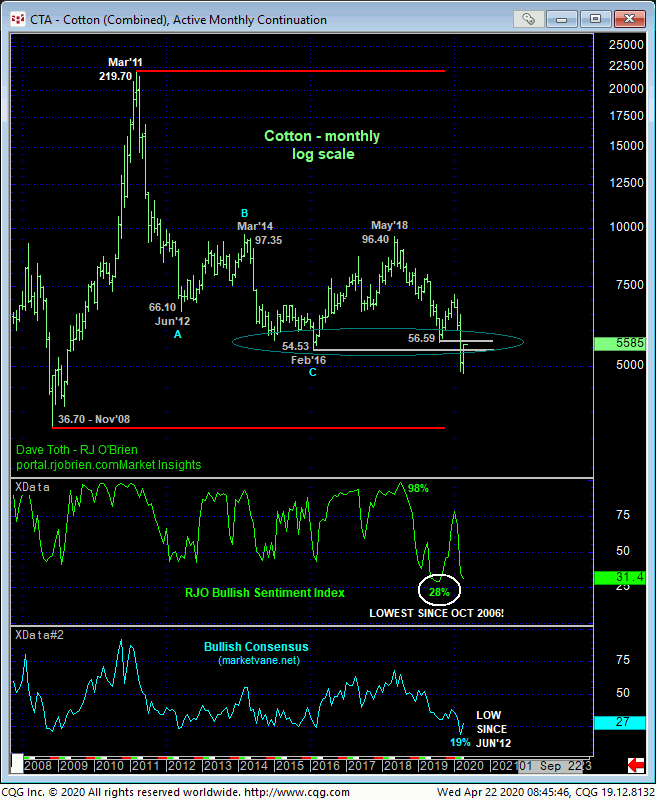
Lastly and from an even broader perspective, the monthly log chart below shows the market’s engagement of former huge support from the 54.50-to-56.50-range that, since demolished last month, cannot be ignored as a major resistance candidate. If the market’s not reversing and if this rebound is only a larger-degree correction, then this 54.50-to-56.50-area is a likely candidate to reject the rebound. But here again lies the importance of yesterday’s 52.01 corrective low, THE specific and objective risk parameter around which to gauge the bull’s resolve and potential.
These issues considered, a new bullish policy is advised with setback attempts to 54.50 OB first approached as corrective buying opportunities with a failure below 52.01 required to threaten this call enough to warrant its cover. In lieu of such sub-52.01 weakness, further and possibly protracted gains straight away are expected as part of a base/reversal process that could be major in scope.


