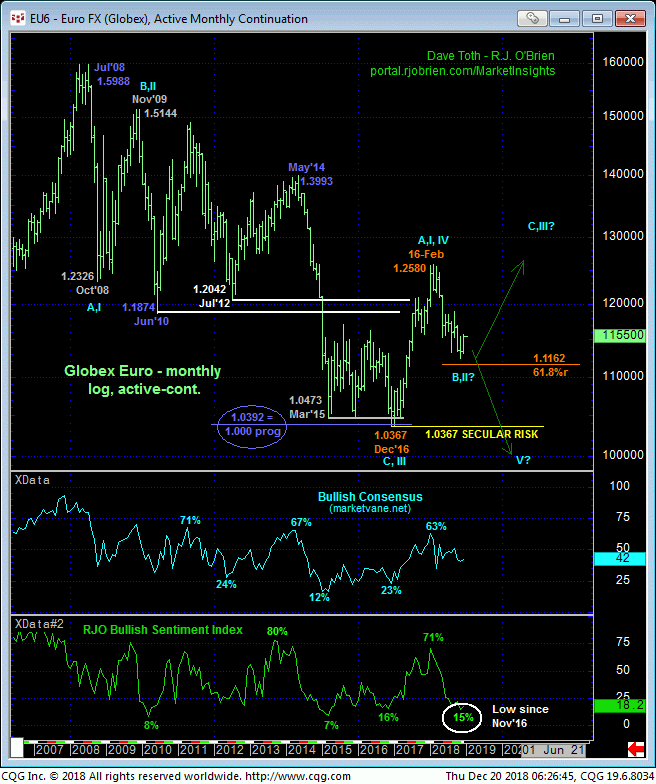
In just Tue’s Technical Blog, discussing the gray area that often times surrounds the futures roll from one contract month to the next, we identified 20-Nov’s 1.1473 high in the underlying cash market as the level the market needed to break above to mitigate a bearish count that contended the labored, lateral recovery attempt from 12-Nov’s 1.1215 low was merely a correction within this year’s major bear trend. The daily chart of the cash Euro below shows a poke above this 1.1473 level that confirms a bullish divergence in momentum and exposes AT LEAST the intermediate-term trend as up.
Of course, we cannot conclude a more significant base/reversal environment after proof of just intermediate-term strength. But what we can conclude is the market’s definition of 14-Dec’s 1.1269 low as the latest smaller-degree corrective low and new short-term risk parameter this market is now obligated to break to render the recovery from 12-Nov’s 1.1215 low a 3-wave and thus corrective affair and re-expose this year’s major downtrend.
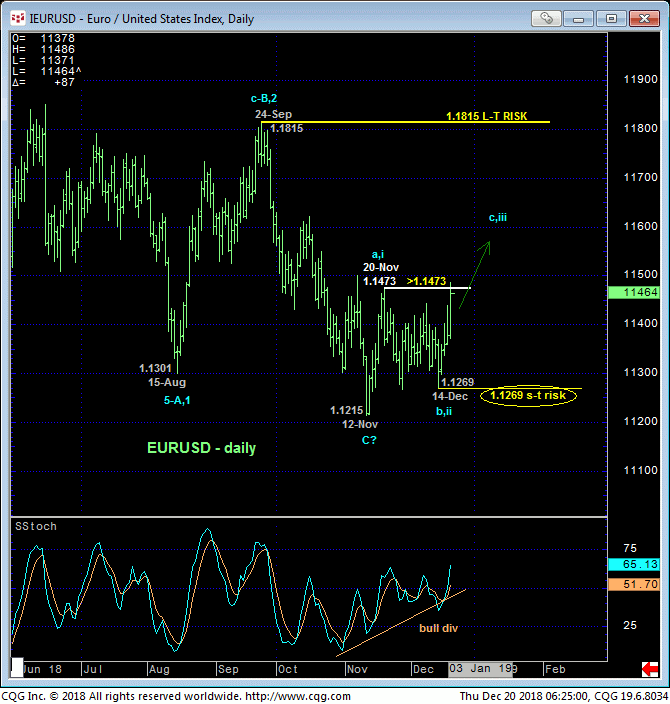
On an active-continuation basis for the contract, the daily chart below shows a similar condition to the underlying cash market with the past couple days’ recovery above 20-Nov’s 1.1495 high in the then-prompt Dec contract confirming a bullish divergence in momentum that defines 12-Nov’s 1.1245 low as THE END of the decline from 24-Sep’s 1.1893 low. This fact not only identifies 11-Dec’s 1.1311 low as THE low and short-term risk parameter the market now needs to fail below to negate any alternate bullish counts and resurrect a broader bearish one, but also exposes AT LEAST the intermediate-term trend as up. The question now is whether this recovery is “only” a steeper correction of Sep-Nov’s portion of 2018’s bear or a more significant reversal higher.
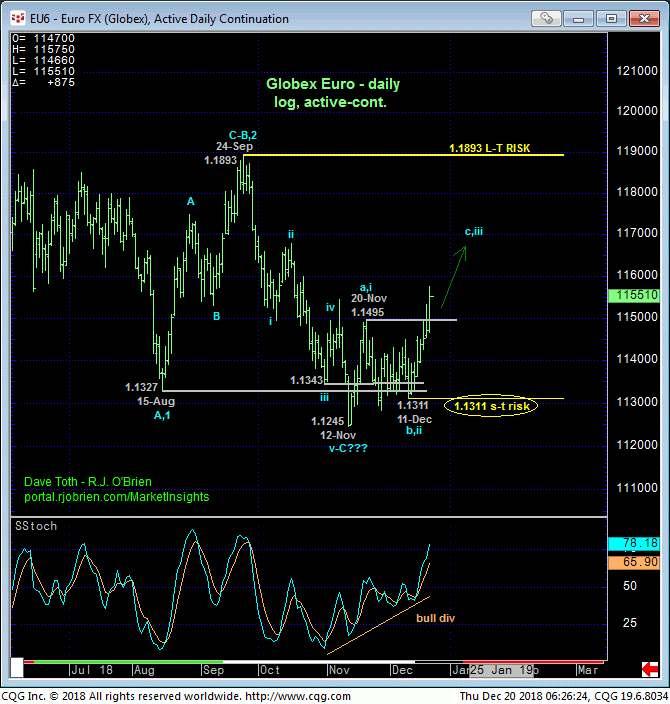
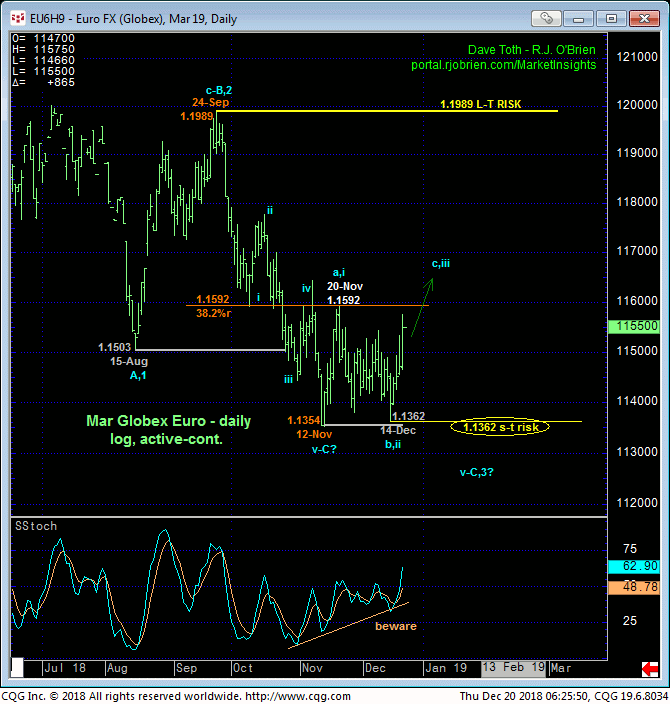
Basis just the now-prompt Mar contract, the 240-min chart above and daily chart below show that the market has yet to breach 20-Nov’s 1.1592 high that is also the exact 38.2% retrace of Sep-Nov’s 1.1989 – 1.1354 decline. This fact maintains an alternate bearish count that the past month’s labored, lateral recovery attempt is merely a correction ahead of a resumption of 2018’s major downtrend.
HOWEVER, today’s continuation of this week’s impressive rebound leaves a low in its wake from yesterday afternoon at 1.1455 that, minimally, the market is now required to fail below to jeopardize the impulsive integrity of a more immediate bullish count discussed above. 14-Dec’s 1.1362 low goes without saying as a key short-term risk parameter to any non-bearish decisions like short-covers and cautious bullish punts. But yesterday afternoon’s 1.1455 serves as a tighter but yet objective micro risk parameter from which such non-bearish decisions can be objectively based and managed in exchange for whipsaw risk.

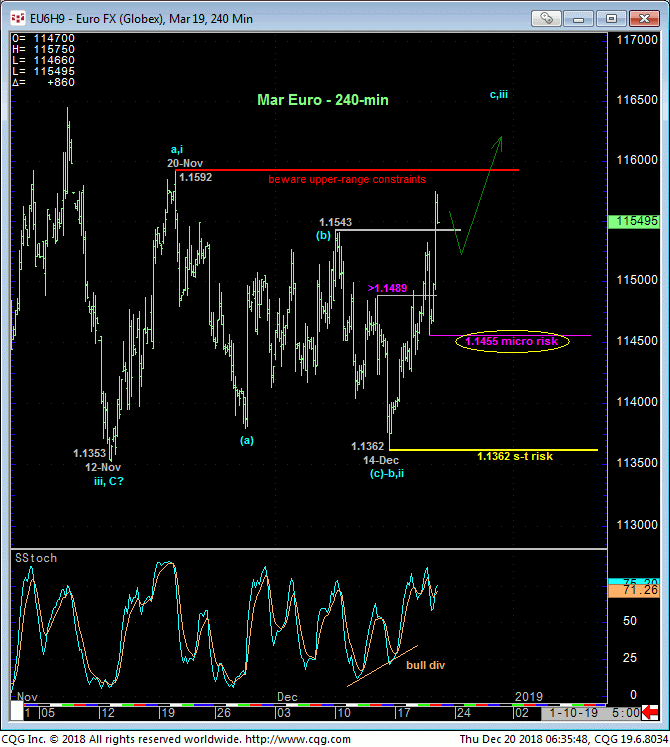
The VERY compelling thing about a broader BASE/reversal count resulting from this week’s recovery is that our RJO Bullish Sentiment Index of the hot Managed Money positions reportable to the CFTC remains at historically bearish levels. Indeed, the 15% reading posted in late-Nov was the lowest since Oct’16, a condition that warned of and accompanied Dec’16’s absolutely huge base/reversal environment.
Again, we cannot conclude a major reversal from only a minor indication of strength above a level like 20-Nov’s 1.1473 high in the underlying cash market. But with market sentiment/contrary opinion at such historically bearish levels, traders are urged to beware of a base/reversal-threat that could be shocking in scope.
On an even broader scale, the monthly log chart below reminds us that this year’s relapse, as extensive as it may seem, remains arguably a corrective subset of Dec’16 – Feb’18’s impulsive rally that, in fact, broke the secular bear market from Jul’08’s 1.5988 high. It’d obviously be premature to conclude 12-Nov’s low (1.1245 in the contract) as the end of a (B- or 2nd-Wave) correction of 2017’s major reversal. But until and unless this market relapses below at least 14-Dec’s 1.1362 low in the Mar contract, a more extensive correction of 2018’s decline OR a resumption of 2017’s uptrend are now legitimate threats.
These issues considered, all previously recommended bearish policy and exposure has been nullified and we next advise traders to first approach setback attempts to 1.1535 OB as corrective buying opportunities with a failure below 1.1455 required to negate this specific call and warrant its cover. IN lieu of such sub-1.1455 weakness further and possibly accelerated gains are anticipated.
