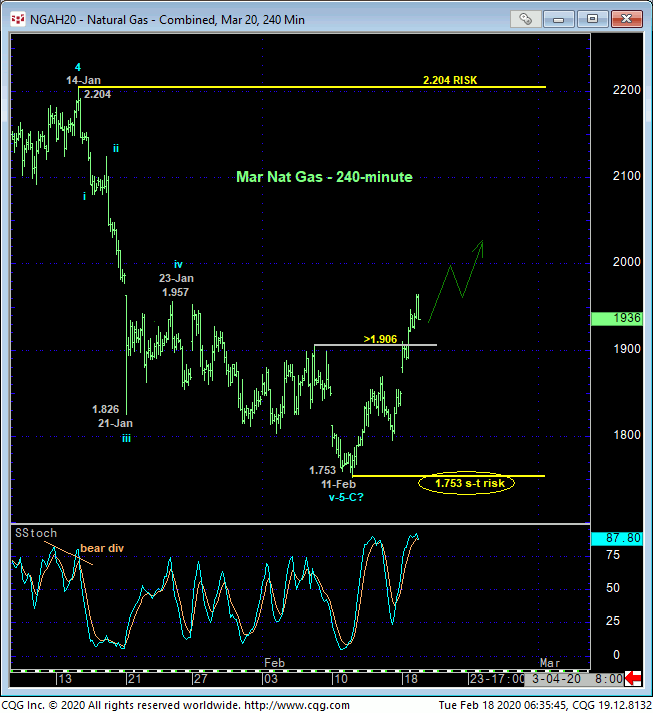
The market’s recovery overnight above 06-Feb’s 1.906 corrective high and our short-term risk parameter discussed in 10-Feb’s Technical Blog confirms a bullish divergence in daily momentum that defines 11-Feb’s 1.753 low as one of developing importance and, for ancillary reasons we’ll discuss below, possibly the END of the past year’s meltdown. From a short-term perspective however, this 1.753 serves as our new short-term risk parameter from which traders can objectively base shorter-term decisions like short-covers and cautious bullish punts.


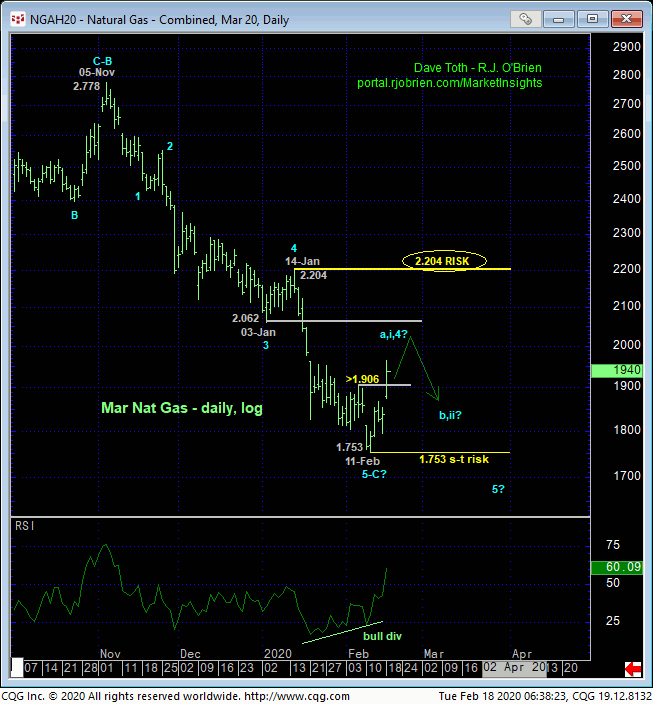
The daily log scale chart above shows the confirmed bullish divergence in momentum. While this mo failure certainly defines 11-Feb’s 1.753 low as one of developing importance and an objective risk parameter from which non-bearish decisions can be objectively based and managed, it is of a grossly insufficient SCALE to conclude the end of the major downtrend from even 05Nov19’s 2.778 high, let alone the secular bear trend. Indeed, commensurately larger-degree strength above 14-Jan’s 2.204 larger-degree corrective high and key risk parameter remains required to, in fact, break the major downtrend. A recovery attempt shy of that 2.204 threshold would fall well within the bounds of a mere (4th-Wave) correction ahead of an eventual resumption of the secular bear.
Herein lies the importance of acknowledgment of and adherence to technical and trading SCALE per one’s personal or corporate risk profile. For longer-term commercial players, it would be premature to conclude a major bottom after such relatively minor strength. By the same token, waiting for larger-degree strength above 2.204 is waaaay outside the risk profile of and thus useless to shorter-term traders. One thing we cannot do is mix scales and conclude a major reversal from short-term strength.
This said, there are crucially important ancillary factors that we believe contribute to a base/reversal-threat environment that could be major in scope, including:
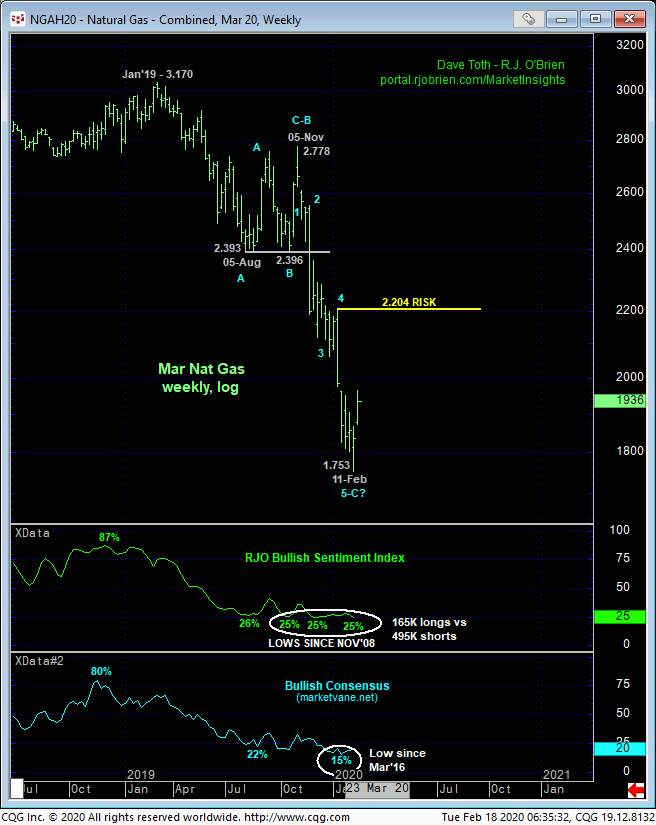
- historically bearish sentiment/contrary opinion level not seen in over 11 YEARS
- an arguably complete 5-wave Elliott sequence down from Nov’s 2.778 high as labeled in the daily chart above and weekly chart below, and, most importantly,

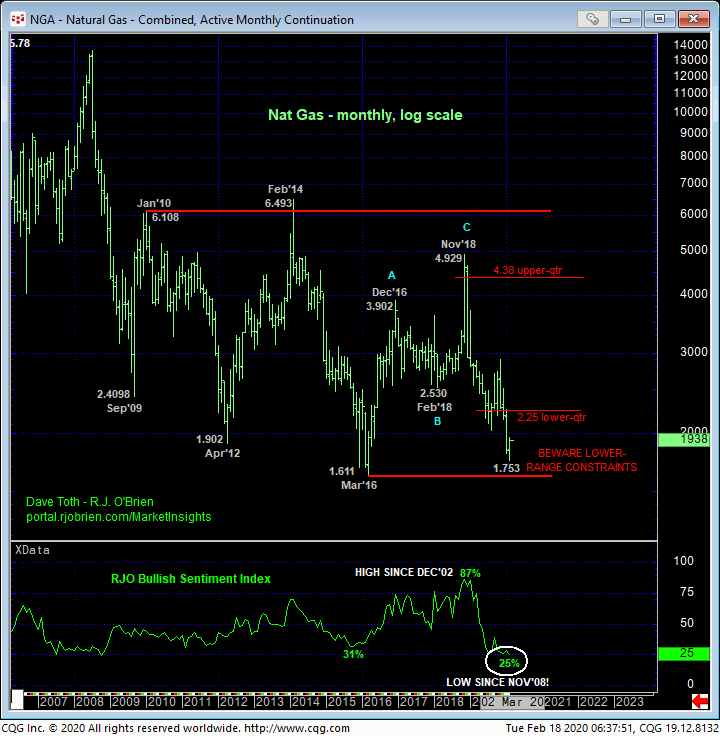
- the market’s position at the extreme lower recesses of its historical range shown in the monthly log active-continuation chart below.
“Down here” and after at least some semblance of a momentum failure that rejects/defines a more reliable low, the risk/reward merits of maintaining a bearish policy, or at least a more aggressive bearish policy, are questionable. Can we CONCLUDE a major reversal after proof of just smaller-degree strength? Of course not. But we CAN conclude 11-Feb’s 1.753 low as a relatively tight but reliable low and support from which the risk of non-bearish decisions can be objectively based and managed.
IF that 1.753 low completed the bear, the forces (technical, fundamental, emotional, whatev’) that drove this market down for quarters aren’t going to evaporate overnight. Indeed, we anticipate a corrective rebuttal to the past week’s rally that could be extensive in terms of both price and time. But if this relapse unfolds in a labored, corrective, 3-wave manner and survives the retest of 11-Feb’s 1.753 low, then the risk/reward merits of migrating to a new bullish policy could be extraordinary in the weeks and months ahead.
These issues considered, shorter-term traders have been advised to neutralize bearish exposure and move to a neutral/sideline position. Longer-term player are advised to pare bearish exposure to more conservative levels and jettison remaining exposure on a recovery above 2.204.


