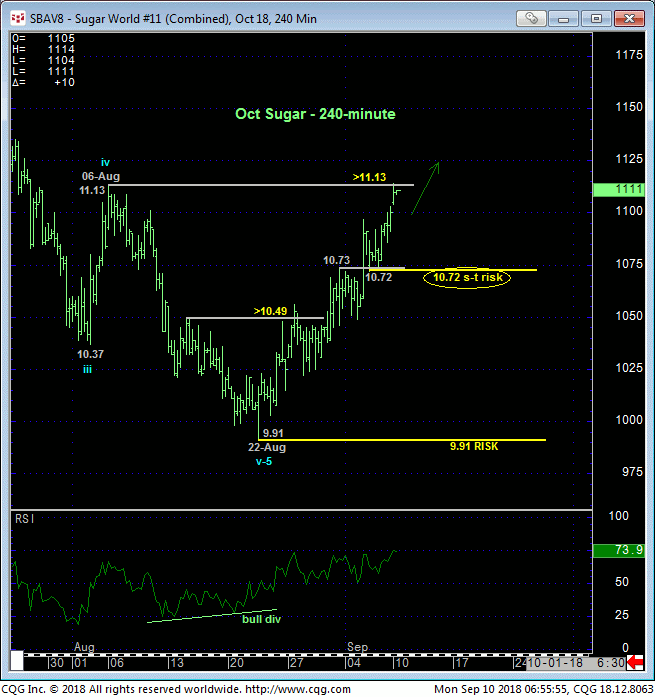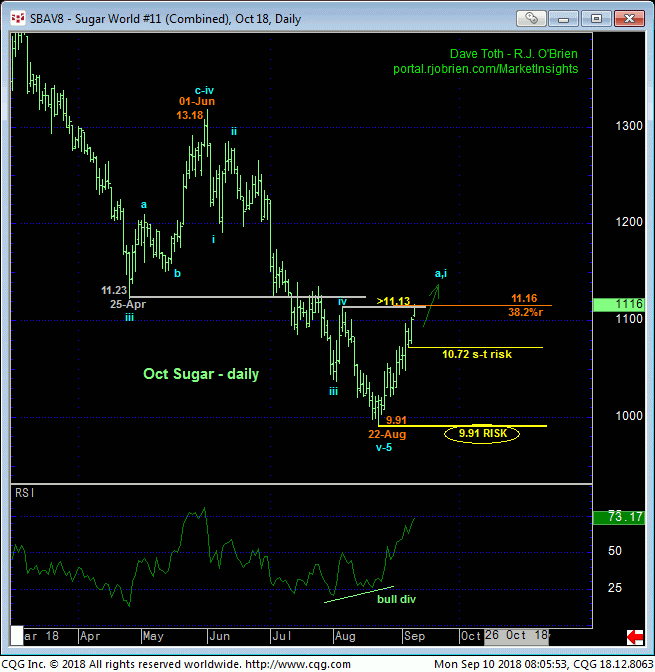
In 27-Aug’s Technical Webcast we discussed that day’s bullish divergence in short-term momentum that defined 22-Aug’s 9.91 low as one of developing importance BUT that it was a momentum failure of a scale INsufficient to conclude a broader base/reversal threat. Two weeks on, this morning’s recovery above 06-Aug’s 11.13 next larger-degree corrective high confirms a bullish divergence in momentum that defines 22-Aug’s 9.91 low as the END of a broader wave sequence down from at least 01-Jun’s 13.18 high and possibly the end of the secular bear from 29Sep16’s 24.10 high.
On a smaller scale Fri and today’s continuation of the 2-week recovery leaves Thur’s 10.72 low and area of former resistance-turned-support as the latest smaller-degree corrective low and new short-term risk parameter from which non-bearish decisions like short-covers and cautious bullish punts can be objectively rebased and managed. This tight but objective risk parameter may come in handy given the prospect for a (b- or 2nd-Wave) corrective rebuttal to what may be only the initial (a- or 1st-Wave) against the secular bear trend.


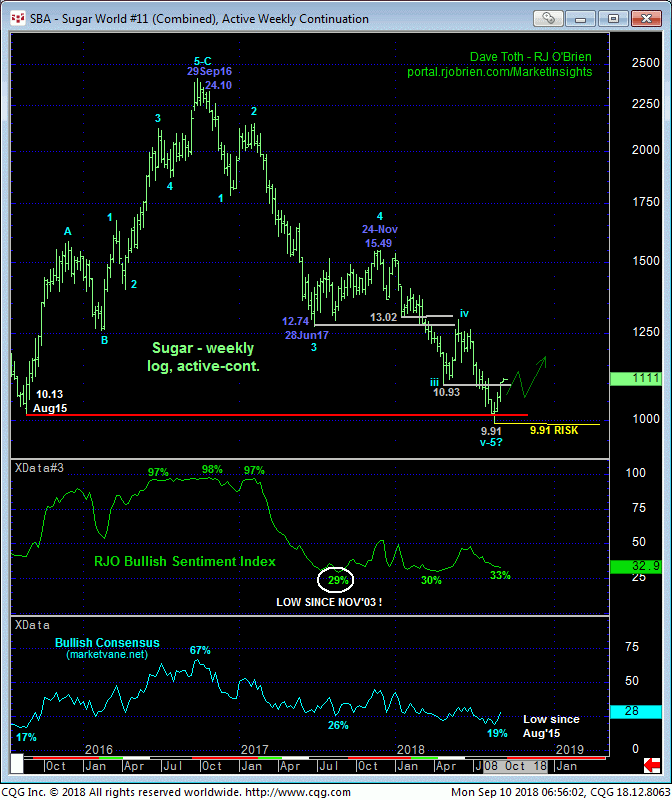
The daily chart above shows the bullish divergence in DAILY momentum above 11.13 that defines 22-Aug’s 9.91 low as the END of a textbook 5-wave Elliott sequence down from 01-Jun’s 13.18 high. Additionally, looking at the weekly log chart below, this Jun-Aug portion of the decline could be the completing 5th-Wave of an even longer-term Elliott sequence dating from Sep’16’s 24.10 high. Historically bearish sentiment levels now come into play as reinforcing factors to such a base/reversal environment that could be major in scope. The market’s rejection thus far of Aug’15’s 10.13 low and some of the lowest prices over the past 10 YEARS also would seem to contribute to a count that warns of upside vulnerability.
This said, this market has thus far only satisfied two of our three reversals requirements: a confirmed bullish divergence in momentum of a scale sufficient to break or threaten the major bear and proof of trendy, impulsive behavior on the initial counter-trend rally. The third requirement that remains to be seen is proof of labored, 3-wave corrective behavior on a subsequent relapse attempt that stays above 22-Aug’s 9.91 low and new key long-term risk parameter.
Indeed, the technical and especially fundamental forces that drove this market down for TWO YEARS aren’t likely to evaporate quickly and allow the market to sustain a new bull trend right out of the shoot. Typical of almost all base/reversal processes is an often times extensive (B- or 2nd-wave) correction of the initial counter-trend rally before the more sustainable and opportunistic (C- or 3rd-wave) rally kicks in with fundamental evidence changing to support a bullish case. Such a corrective rebuttal/retest of the low remains to be seen and remains a risk for anyone looking to “chase” bullish exposure on this initial counter-trend run-up. For those who are comfortable with such chasing however, we urge a tighter but objective protective sell-stop just below 10.72.

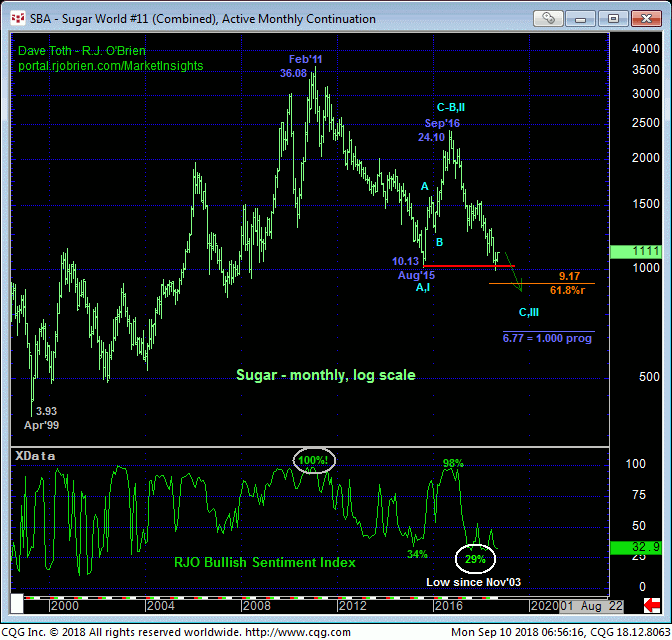
Finally, the monthly log chart below shows the market’s failure to sustain losses below Aug’15’s 10.13 low and the lowest prices since 2008. On this scale the past couple weeks’ rebound hardly registers and is insufficient to conclude anything more than a larger-degree correction within the secular bear trend from Feb’11’s 36.08 high that could still make a run at sub-7.00 levels like we discussed in 21-Jun’s Technical Blog. For the time being and as a result of the past couple weeks’ rebound however, that bear trend has at least been interrupted in exchange for a larger-degree correction higher.
The weekly chart above shows a good but of former 12.75-to-13.00-area support-turned-resistance. To truly threaten the secular bear trend commensurately larger-degree strength above at least the 01-Jun’s 12.97 high in the then-prompt Jul contract would be needed.
These issues considered, a neutral-to-cautiously-bullish stance remains advised for shorter-term traders with a failure below 10.72 negating this call and warranting a move to the sidelines. Long-term players have been advised to cover previously recommended bearish exposure and are further advised to maintain a neutral/sideline position for the time being in order to circumvent the heights unknown of this initial counter-trend rally. We will be watchful for a countering bearish divergence in short-term mo to arrest the clear and present intermediate-term uptrend and expose that suspected corrective relapse that could even provide a nice risk/reward scalp from the bear side in the meantime. In lieu of at least sub-10.72 weakness, further and possibly accelerated gains should not surprise.


