In 13-Aug’s Technical Blog following 10-Aug’s reaffirmation of this year’s major downtrend, we identified 08-Aug’s 1.1662 high as the latest SMALLER-degree corrective high and a short-term risk parameter this market was MINIMALLY required to recoup to threaten the bear. The 240-min chart and daily log chart below show that the past week’s rebound has thus far only recovered to an area of key former support from the mid-1.15-handle area that, since demolished a week-and-a-half ago, should be considered a key new resistance candidate.
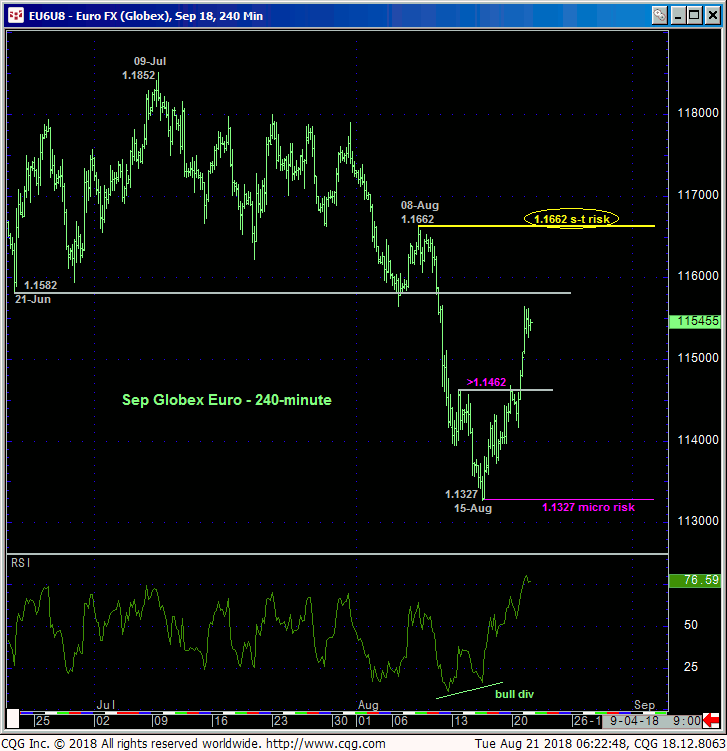
Overnight’s clear break above 13-Aug’s 1.1462 corrective high does confirm a bullish divergence in momentum that defines 15-Aug’s 1.1327 low as one of developing importance, but this mo failure is thus far of an insufficient scale to conclude the end of a 6-month, 10% decline. HOWEVER…..
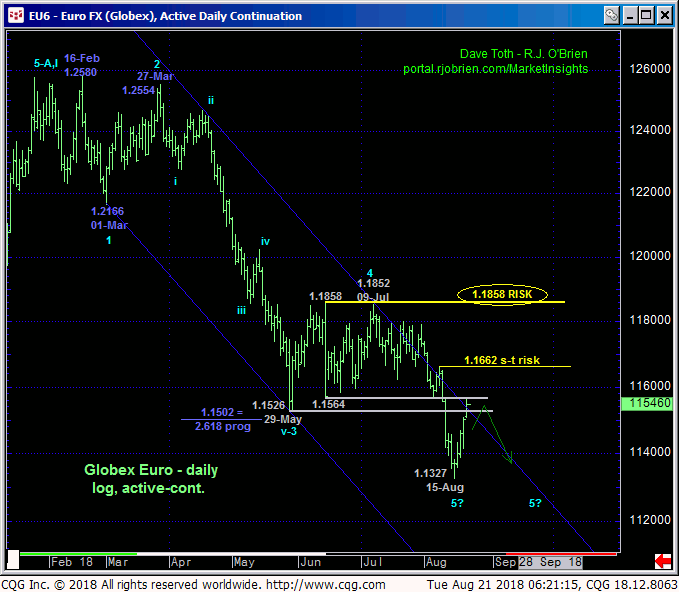
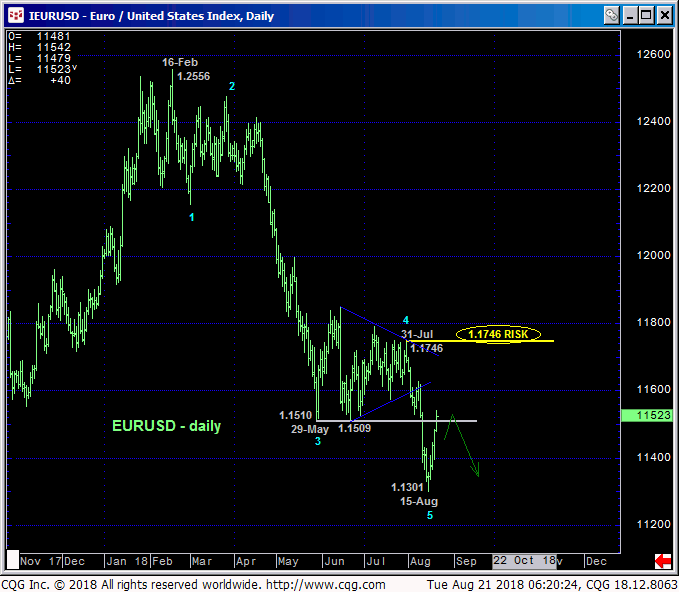
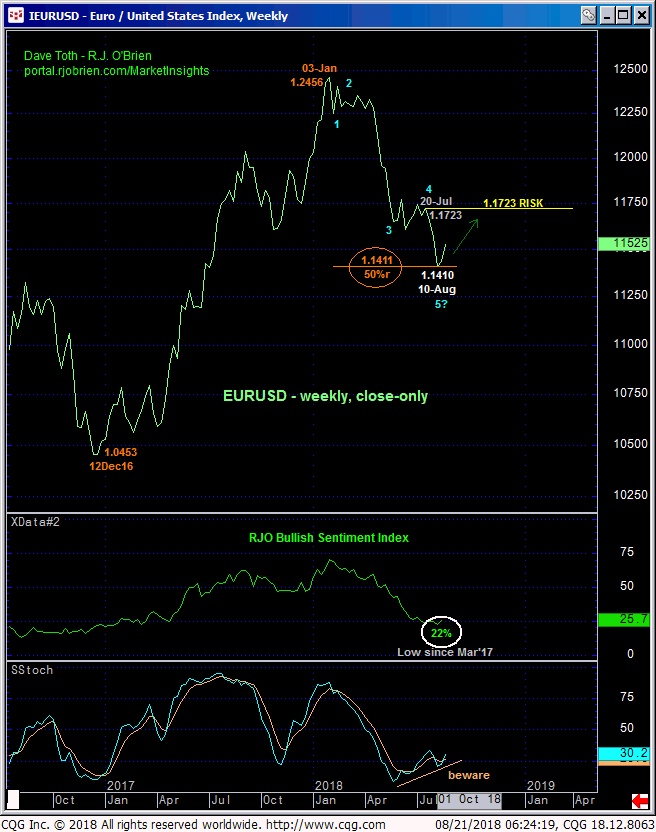
For you Elliott Wave geeks, the decline from 16-Feb’s 1.2556 intra-day high in the cash Euro (above) or 03-Jan’s 1.2456 high weekly close (below) is an absolute textbook 5-wave structure. Granted, commensurately larger-degree proof of strength above 31-Jul’s 1.1746 intra-day high and suspected end to a 4th-Wave triangle correction and/or above 20-Jul’s 1.1723 corrective high weekly close remains required to confirm the bullish divergence in momentum necessary to, in fact, break this year’s downtrend.
HOWEVER… The weekly chart below also shows:
- waning downside momentum amidst
- the lowest reading (22%) in our RJO BSI since Mar’17 and
- the market’s rejection thus far of the EXACT (1.1411) 50% retracement of the entire rally from Dec’16’s 1.0453 low to Jan’18’s 1.2456 high.
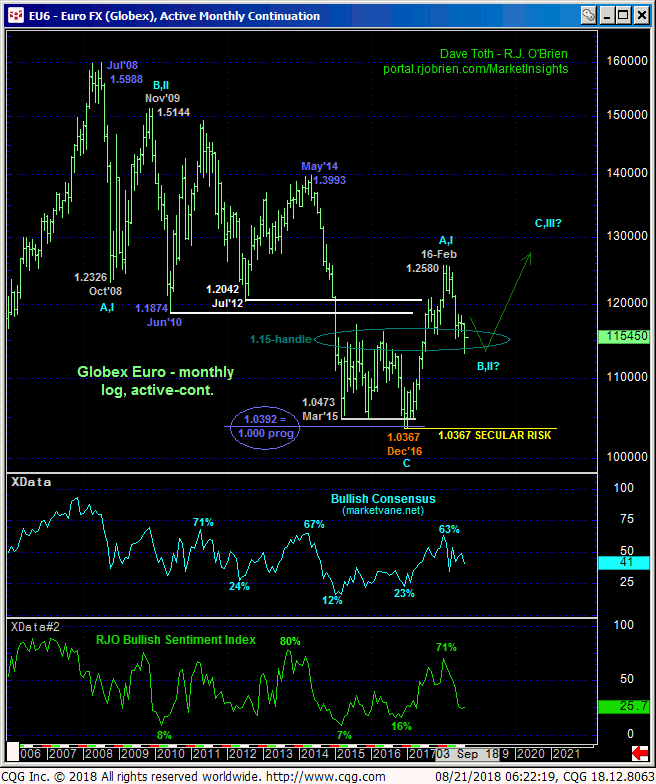
Additionally, and from an even longer-term perspective, the monthly log active-continuation chart of the contract shows the importance of the general 1.15-handle-area as key former resistance that, since broken in Jul’17, now serves as a key new support candidate within what we still believe is a huge, multi-year BASE/reversal-threat environment to levels ultimately well above 1.26. Such a long-term bullish move in the Euro and decline in the USD is on NOBODY’S radar screen currently. But the technical fact of the matter is that the extent and impulsiveness of 2017’s rally broke the secular downtrend and warns that the new secular trend is arguably up. And that 2018’s relapse is part of a CORRECTION within this multi-year bottoming process.
Of course, it is grossly premature to conclude even a larger-degree correction of this year’s decline, let alone its reversal, from just the past week’s hiccup. Indeed, “more” is required of the bull like further gains above at least 1.1662 AND proof of 3-wave, corrective behavior on subsequent relapse attempts (the third of our three reversal requirements). And a relapse below our micro risk parameter at 1.1327 will negate any base/reversal count, reinstate the bear and re-expose potentially steep Euro losses. But until and unless this market actually does fail below 1.1327 and if it inches up more in the days/week ahead to levels above the 1.15-handle-area resistance, the Elliott, momentum, sentiment and Fibonacci factors specified above provide the basis for a correction or reversal higher that could stun the huddled masses.
These issues considered, traders are advised to pare bearish exposure to more conservative levels and jettison the position altogether on a recovery above 1.1662. We will be watchful for proof of labored, 3-wave behavior on subsequent relapse attempts in the period immediately ahead for favorable and potentially very compelling risk/reward BUYING opportunities. A relapse below 1.1327 mitigates any base/reversal count, reinstates the bear and exposes potentially sharp losses thereafter.
