Posted on Aug 01, 2022, 09:32 by Dave Toth
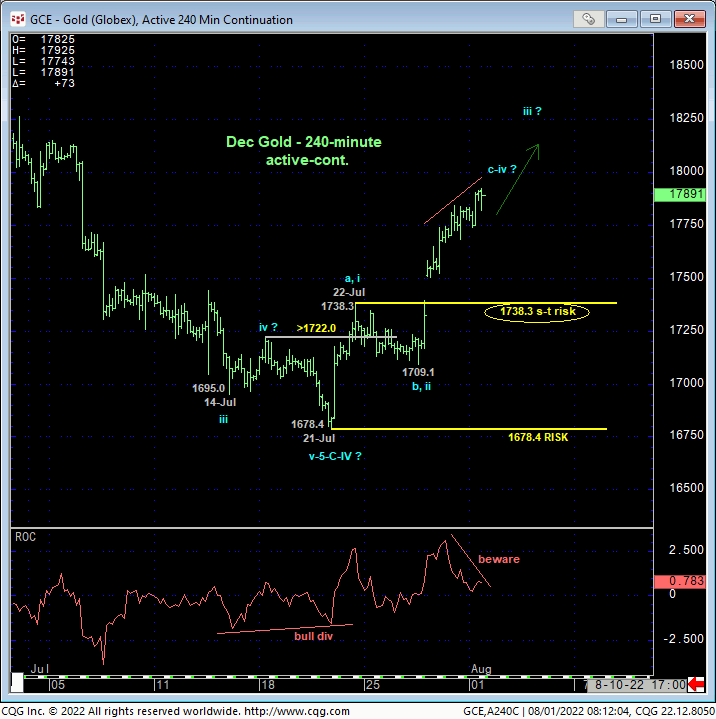
DEC GOLD
While the magnitude of this year’s $400, 19% decline is such that the past couple weeks’ $110 rebound easily falls within the bounds of a mere correction, the fact that this rebounds stems from the extreme lower recesses of the TWO-YEAR range amidst the lowest sentiment/contrary opinion levels in roughly THREE YEARS warn us not to underestimate this market’s upside potential in the months and even quarters ahead. Per such and given the market’s recovery above 16-May’s 1785-area of former support-turned-resistance and our key long-term bear risk parameter, long-term commercial players have been advised to move to a neutral/sideline policy in order to circumvent the heights unknown of what we believe is just the initial (A- or 1st-Wave) of a larger-degree correction or reversal higher.
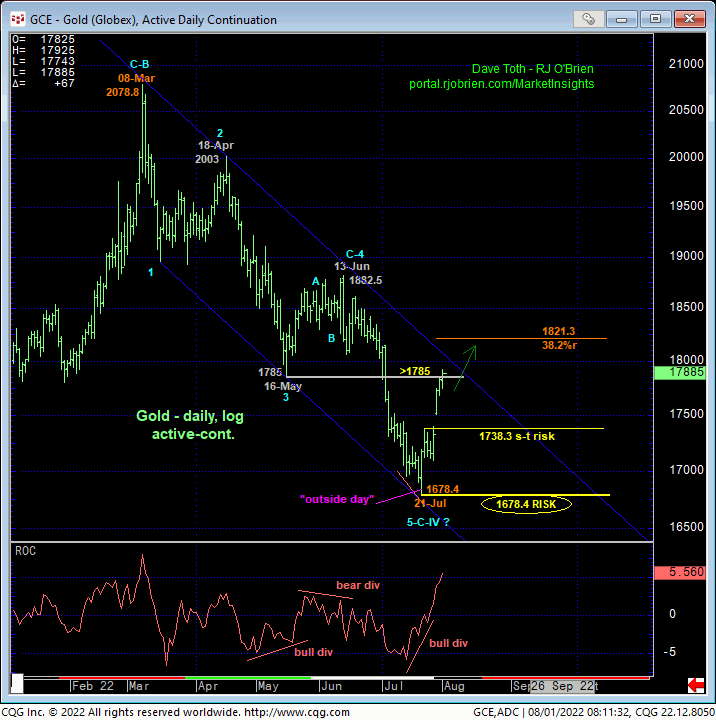
Drilling down to a daily log chart above and 240-min chart below, these charts show the extent and impulsive manner of the past few days’ portion of the recovery being too long in the tooth to be a correction of just Jun-Jul’s portion of this year’s bear from 1182.5 to 21-Jul’s 1678.4 low. Thus, this recovery is big enough to conclude that 1678.4 low as the END of a 5-wave Elliott sequence from 08-Mar’s 2078.8 high and our new long-term risk parameter from which non-bearish decisions like short-covers and new bullish punts can be objectively based and managed by longer-term commercial players and investors.
This said, this daily chart shows the market only now encroaching on a key area of former support from May/Jun around the 1785-to-1806-area that, since obliterated by early-Jul’s meltdown, is approached as a new key resistance candidate. Additionally, the Fibonacci minimum 38.2% retrace of Mar-Jul’s decline from 2078.8 to 1678.4 cuts across at the nearby 1821-area. Against this backdrop, we suspect that this initial and eventual 5-wave rally from 21-Jul’s 1678.4 low will exhaust itself somewhere around 1825-to-1850 before succumbing to a (B- or 2nd-Wave) corrective rebuttal to this initial counter-trend rally. Mar-Apr’s 1st-Wave-down and 2nd-Wave recovery PEAK/reversal provides an excellent proxy for such a reversal process, only the upcoming version would be a BASE/reversal process. Per such, traders are advised not to “chase” this initial counter-trend recovery because the risk/reward metrics of doing so are poor.
Per this point and while at least the intermediate-term trend is up on a 240-min scale below, this chart also shows the developing potential for a bearish divergence in momentum. Combined with last Thur’s gap-up so early in this reversal process, we believe that after an initial 5-wave rally up from 1678.4 is discernible, this market will experience a corrective relapse that will provide an interim risk/reward opportunity from the bear side before an eventual and possibly extraordinary risk/reward opportunity from the bull side after a larger-degree 3-wave correction of this initial rally. At this juncture however, a relapse below former 1738.3-area resistance-turned-support from 22-Jul and our suspected minor 1st-Wave high is required to negate this uptrend and warrant non-bullish decisions like long-covers for shorter-term traders. In lieu of such weakness, further gains remain expected in the period immediately ahead.

SEP SILVER
With the exception of the silver market blowing out the key 21.41 lower boundary to the 2020-2021 range that confirmed a secular bear trend, its technical construct is the same as that detailed in gold following last Thur’s bullish divergence in daily momentum and the extent and impulsiveness of the subsequent recovery. What is pertinent in the weekly log chart below is the prospect that the decline from 08-Mar’s 27.495 high is a complete 5-wave Elliott sequence amidst sentiment/contrary opinion levels that are the lowest in at least 2-1/2-YEARS and, in the case of our RJO Bullish Sentiment Index, the lowest since Jun 2019.
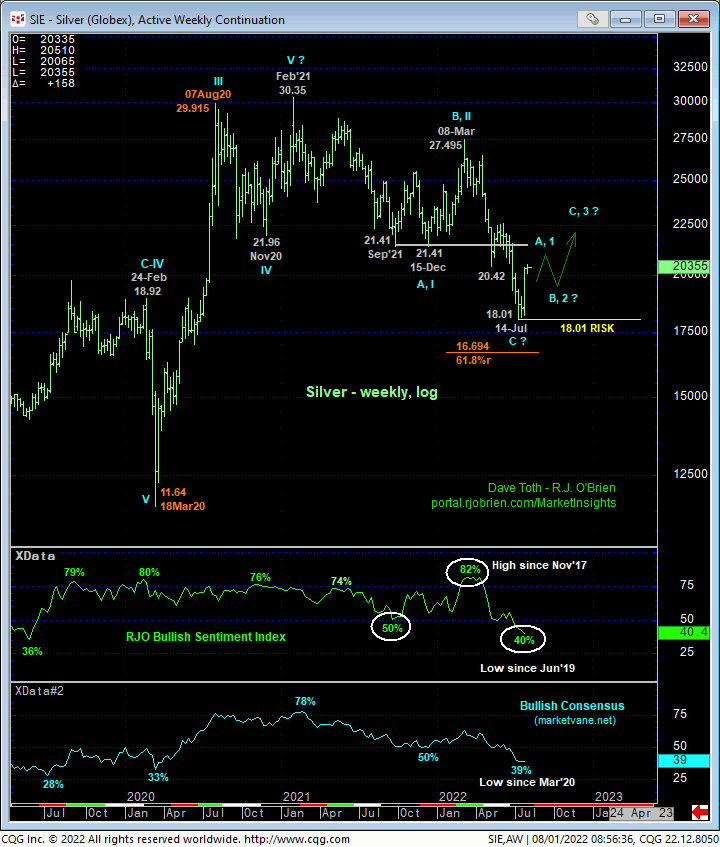
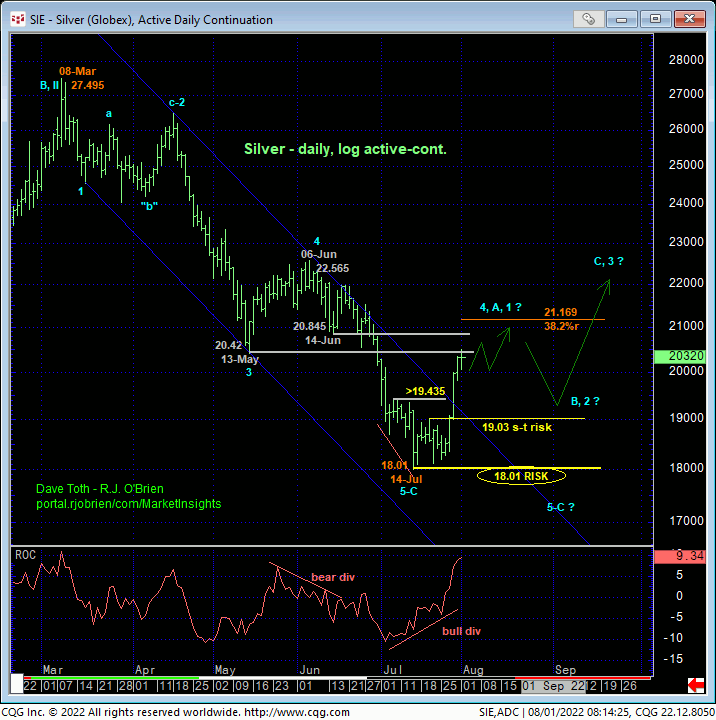
The daily log chart above shows last week’s bullish divergence in momentum that arguably completes a textbook 5-wave Elliott sequence down from 08-Mar’s 27.495 high at 14-Jul’s 18.01 low. 20-Jul’s 19.03 high is considered the minor 1st-wave high of what we suspect is an initial 5-wave sequence up from 18.01 and a level this market is expected to sustain gains above per a broader bullish count. Per such, these levels represent our new short- and long-term risk parameters from which non-bearish decisions like short-covers can be objectively based and managed.
Here too however, we suspect this initial counter-trend rally to run into resistance around the 20.40-to-21.17-area in the week or two ahead before a (B- or 2nd-Wave) corrective rebuttal lower. Just like the 1st-Wave down and 2nd-Wave recovery in Mar-Apr described that PEA/reversal process, we believe that somewhere along the line this market will experience a correction of this current rally attempt that would provide a much preferred risk/reward opportunity from the bull side. It’s one thing to neutralize any/all remaining bearish exposure as a result of the past few days’ rally. “Chasing” bullish exposure “up here” presents poor risk/reward merits.
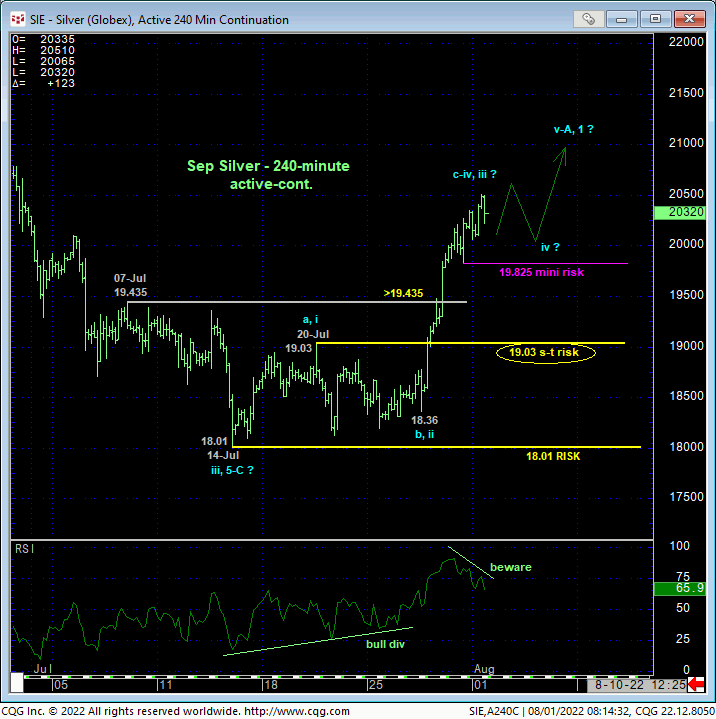
Indeed, the 240-min chart below shows the developing potential for a bearish divergence in short-term momentum that we believe will be confirmed on a failure below a very minor corrective low at 19.825 from Fri. For those shorter-term traders willing to chase bullish exposure up here around 20.33, 19.825 would be an appropriately tight but objective risk parameter from which to do so.
These issues considered, a neutral-to-cautiously-bullish stance is advised with a failure below 19.825 required to arrest this recovery and expose a corrective setback of a sufficient scale to move to neutral in order to avoid the depths unknown of a suspected 4th-Wave or 2nd-Wave relapse.
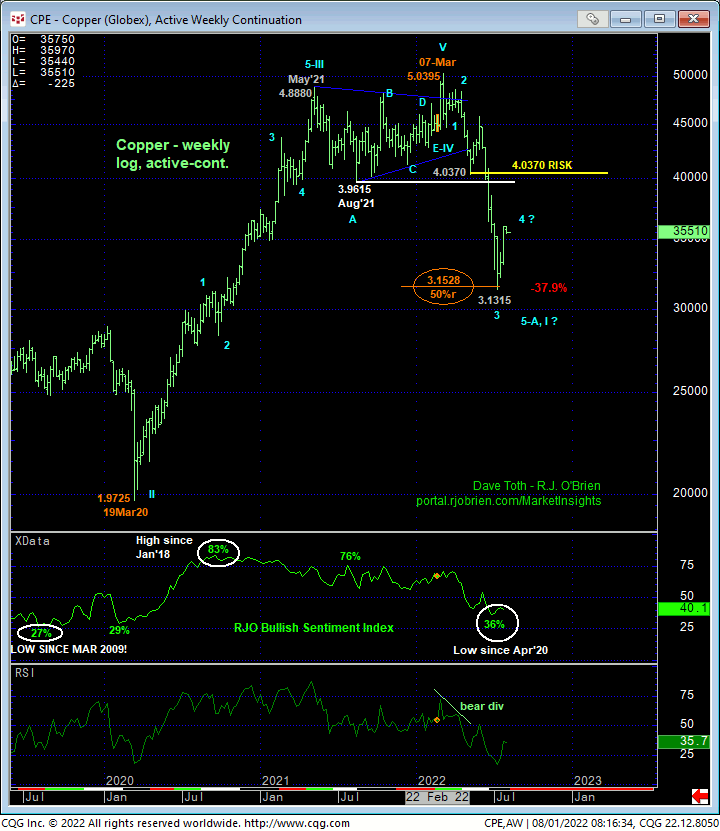
SEP COPPER
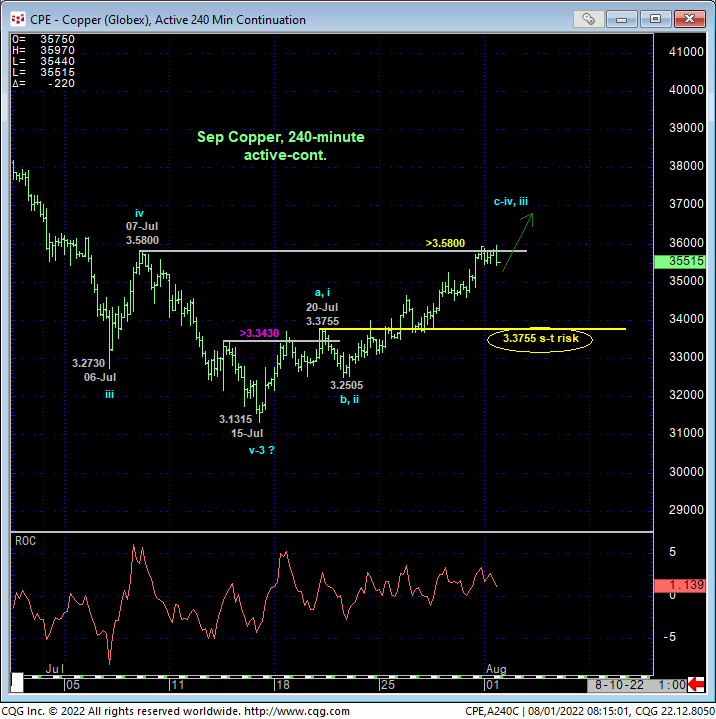
Similarly, today’s recovery above 07-Jul’s 3.5800 corrective high and our short-term but key risk parameter confirms a bullish divergence in daily momentum that breaks the downtrend from at least 03-Jun’s 4.5770 high. While the past couple weeks’ recovery is not unimpressive however, it remains well within the bounds of a mere correction within the secular bear trend. Commensurately larger-degree strength above at least former support-turned-resistance around 12-May’s 4.0370 low remains required to truly break this year’s major downtrend. As there’s a lotta green between 3.5800 and 4.0370 however, rendering that 4.0370 level impractical, we advised even long-term commercial players to move from a bearish to neutral stance on a recovery above 3.5800, essentially acknowledging and accepting whipsaw risk, back below at least 3.3755, in exchange for much steeper nominal risk above 4.0370.
On a smaller scale, the 240-min chart below shows a 20-Jul high at 3.3755 that is either the a-Wave of a mere 3-wave bear market correction or the 1st-wave of an initial 5-wave rally from 15-Jul’s 3.1315 low of a broader base/reversal count. A failure below 3.3755 is required to jeopardize the impulsive integrity of a broader bullish count and reinforce the 3-wave corrective nature of this recovery consistent with a still unfolding major bearish count. Per such, this 3.3755 level serves as our new short-term but key risk parameter around which we believe directional biases and exposure can be objectively toggled. The Fibonacci fact that this market has retraced to near 38.2% of Jun-Jul’s portion of the bear from 4.5770 to 3.1315 highlights the importance of this market’s ability to sustain further trendy gains and NOT fail below 3.3755.
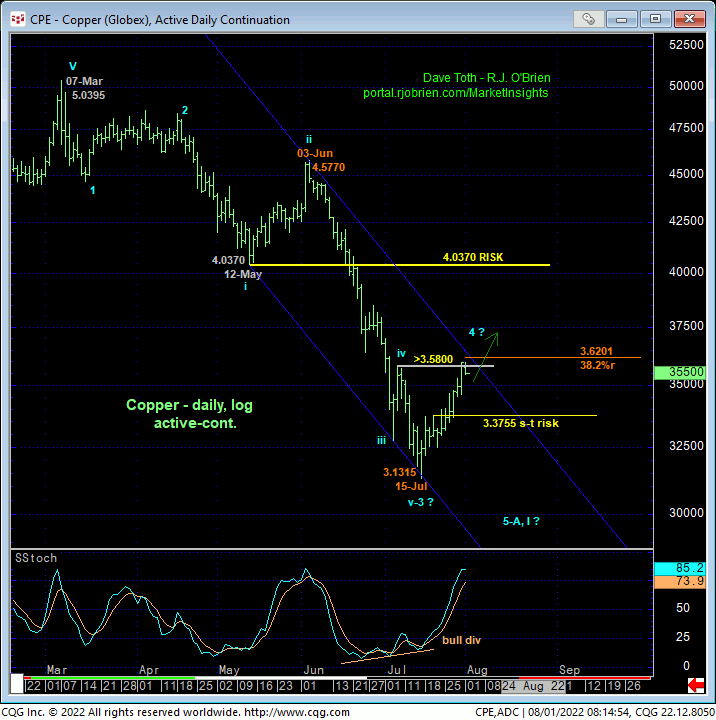
On a much longer-term basis, the weekly log chart below shows the market’s rejection thus far of the (3.1528) 50% retrace of 2020 – 2022’s entire secular bull trend from 1.9725 to 5.0395. Combined with the deterioration to a 36% reading in our RJO Bullish Sentiment Index, its lowest level since Apr’20, traders are advised not to underestimate the extent to which this market might now have become vulnerable to higher levels. This said and for what it’s worth, we cannot identify a complete 5-wave Elliott sequence down from the Mar high. This suggests that the past few weeks’ recovery attempt might only be a (4th-wave) correction ahead of an eventual (5th-Wave) resumption of the bear to new lows below 3.1315. Herein lies the importance of that short-term but key bull risk parameter at 3.3755.
These issues considered, a neutral-to-cautiously-bullish stance is advised with a failure below 3.3755 negating this call and re-exposing this year’s major bear trend.