Posted on Sep 29, 2022, 07:35 by Dave Toth
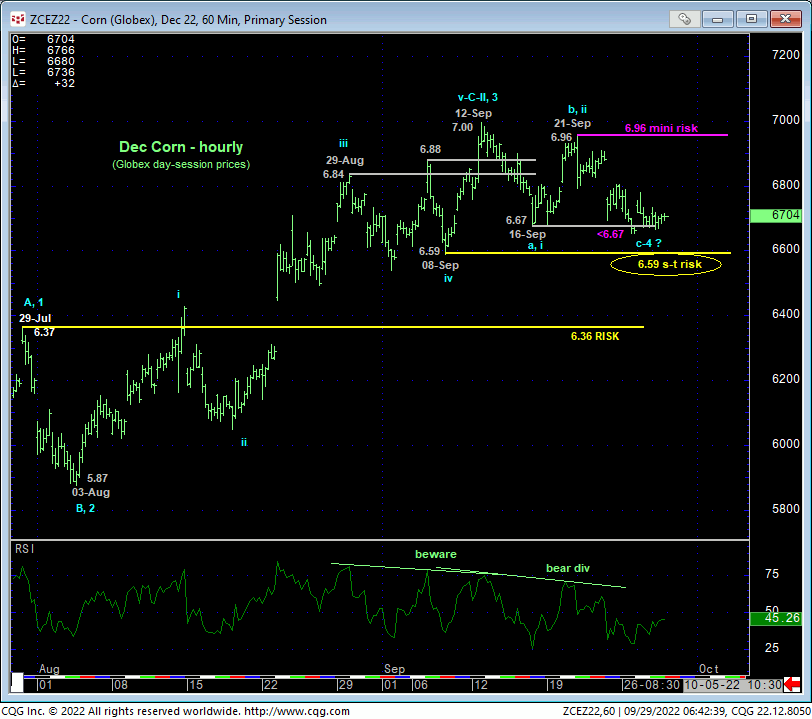
In 19-Sep’s Technical Blog, we honed in on the 6.59/6.58-area as the short-term risk parameter this market needs to sustain gains above to maintain a more immediate bullish count. The hourly chart below shows the market thus far satisfying this requirement with the still-bullish prospect that the past couple weeks’ setback attempt thus far is just a (4th-Wave) correction within the past couple months’ recovery.
This said, Mon’s slip below 16-Sep’s 6.67 initial counter-trend low confirms a bearish divergence in very short-term momentum, leaving 21-Sep’s 6.96 high in its wake as the level this market now needs to recoup to confirm the setback from 12-Sep’s 7.00 high as a 3-wave and thus corrective affair and re-expose the 2-month rally. In this smaller-degree case, that 6.96 level serves as a mini risk parameter from which very short-term traders can objectively base non-bullish decisions like long-covers and cautious bearish punts.
In effect, we believe this market has identified 6.96 and 6.59 as smaller-degree but pivotal flexion points around which shorter-term traders with tighter risk profiles can objectively toggle directional biases and exposure. Heading into tomorrow’s key crop reports however, either of these levels is easy prey to be quickly and decisively demolished. Per such, below, we discuss conservative, fixed-risk but favorable risk/reward option strategies for both end-users and producers.
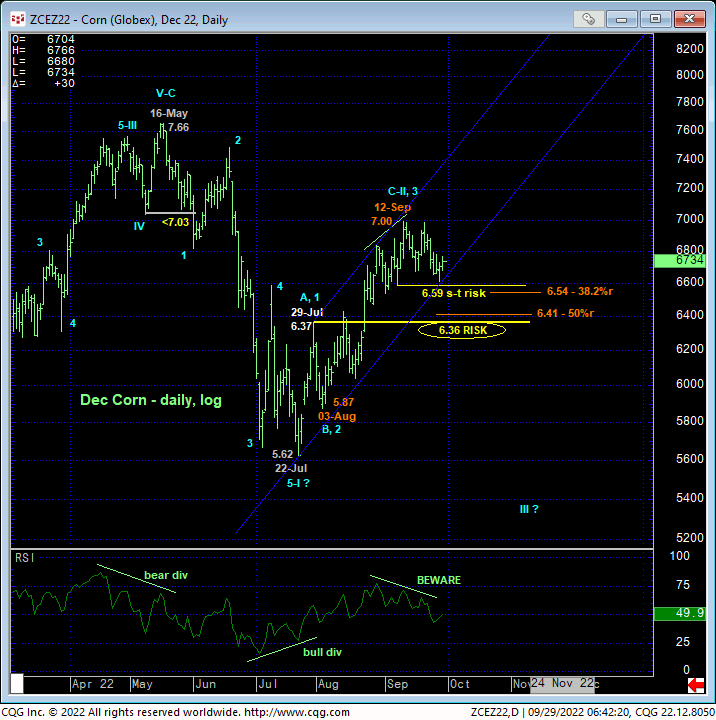
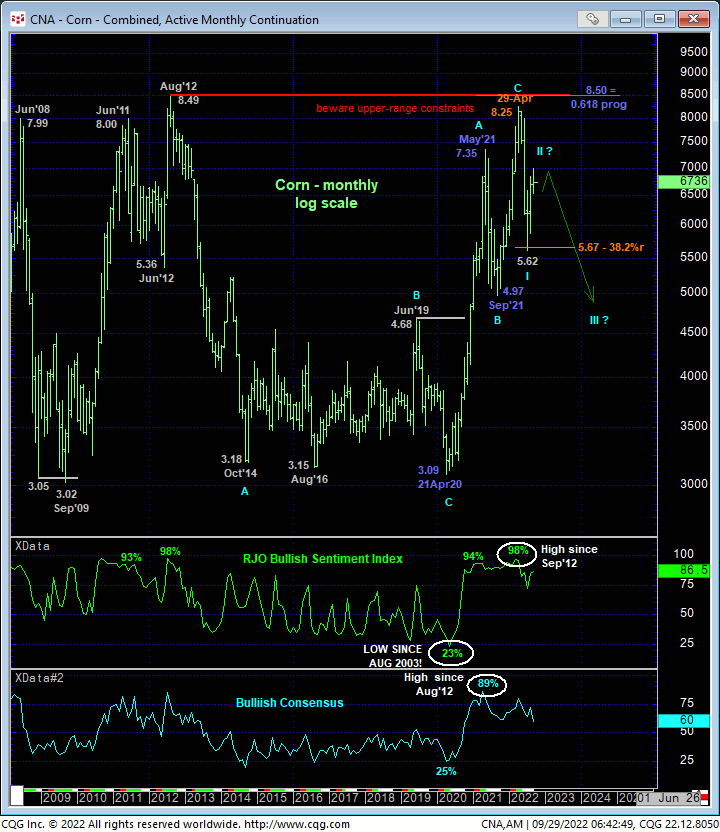
From a longer-term perspective and as recently discussed, the past couple months’ recovery from 22-Jul’s 5.62 low is not unimpressive. Still nearly a dollar away from 16-May’s 7.66 high however, this admittedly and expectedly “extensive” recovery still falls well within the bounds of a mere 2nd-Wave correction of May-Jul’s even more impressive (prospective 1st-Wave) decline within a massive peak/reversal process. This peak/reversal process remains predicated on:
- a confirmed bearish divergence in WEEKLY momentum amidst
- historically frothy bullish sentiment
- a complete 5-wave Elliott sequence from Jul’21’s 4.63 low that
- completes a major 3-wave (B-Wave) sequence from Jun’20’s 3.69 low
- proof of trendy, impulsive, textbook 5-wave behavior down on May-Jul’s (suspected INITIAL) counter-trend decline, and….
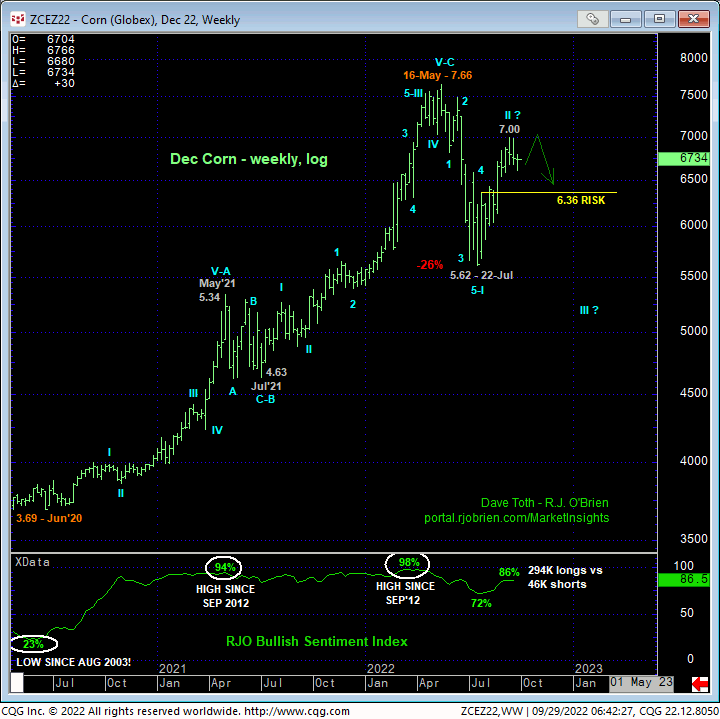
- the market’s clear rejection of the extreme upper recesses of its historical range on a monthly log active-continuation basis below.
To negate this major peak/reversal process, MINIMALLY, the Dec contract needs to BEHAVE LIKE A BULL and prove trendy, impulsive, increasingly obvious behavior higher and take out its 16-May high of 7.66. Even that price action would leave the corn market $0.60-cents shy of this year’s 8.25 high on an active-continuation basis. The market’s failure to satisfy this requirement, will not only threaten any alternate bullish count, but will reinforce our preferred peak/reversal count and expose a dramatic 3rd-Wave decline to new and major lows below Jul’s 5.62 low. Herein lies the importance of our bull risk parameters at 6.59 (short-term) and 29Jul’s 6.37 high, the failure below which will confirm Jul-Sep’s recovery as a 3-wave and thus (2nd-Wave) correction within the massive peak/reversal process.
These issues considered, short-term traders are advised to toggle directional biases and exposure around the 6.96 and 6.59 key flexion points. Longer-term commercial players remain OK to maintain a cautious bullish policy with a failure below 6.59 required to pare exposure to more conservative levels and commensurately larger-degree weakness below 6.37 required to reverse into a new bearish policy and exposure. Below, we present bear and bull hedge strategies structured around these specific key technical levels.
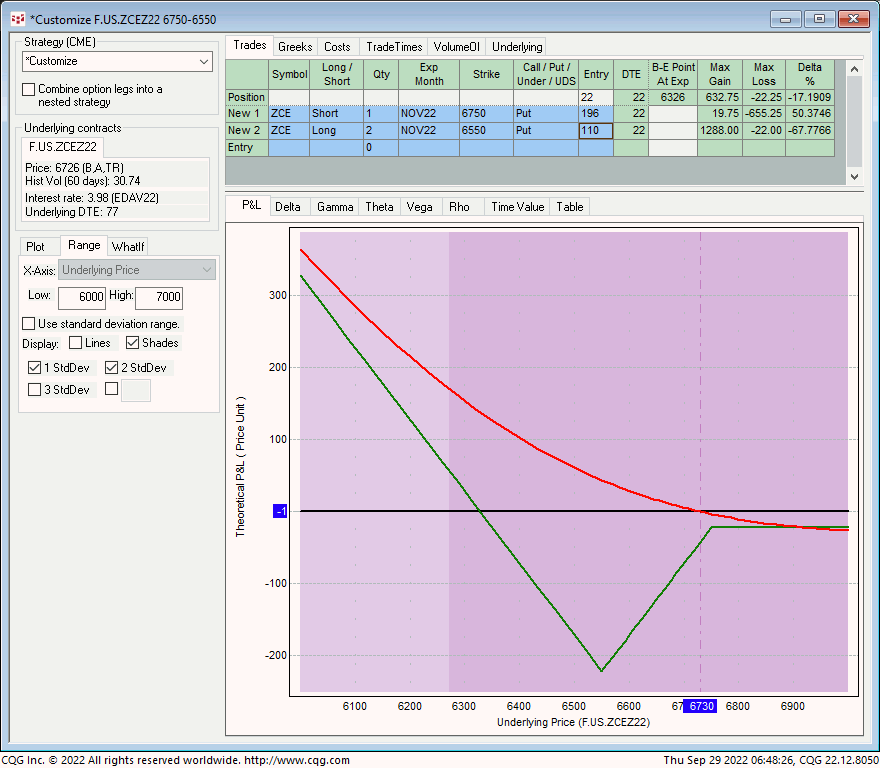
PRODUCER BEAR HEDGE: NOV 6.75 / 6.55 PUT BACK SPREAD
Because a 2-month uptrend remains arguably intact and could continue or even accelerate, we want to minimize maximum risk/cost to any bearish strategy if this trend continues. The put back spread strategy is the perfect application where producers are betting on a “move away from” recent price action, either in an acceleration higher OR a sharp reversal lower as a result of tomorrow’s key crop reports. This strategy involves selling 1-unit of the Nov 6.75 puts around 19-3/4-cents and buying 2-units of the Nov 6.55 puts around 11-cents for a net initial cost of about 2-1/4-cents. This strategy provides:
- a current net delta of -18%
- negligible risk/cost if the current 2-month rally extends/accelerates
- maximum risk/cost of 22-1/4-cents if the underlying Dec contract settles at 6.55 at expiration 22 days from now on 21-Oct
- virtually unlimited, dollar-for-dollar downside hedge protection below its 6.33 breakeven point at expiration.
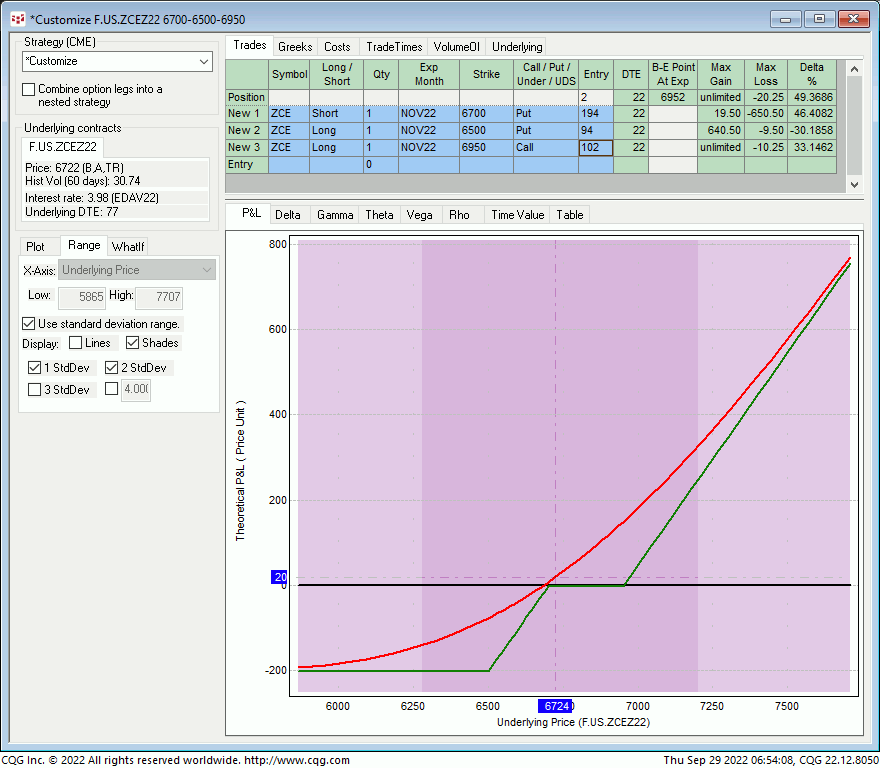
END-USER BULL HEDGE: SHORT NOV 6.70 – 6.50 PUT SPREAD / LONG NOV 6.95 CALL COMBO
To protect against an acceleration of the past couple months’ rally while also defining fixed and maximum downside risk, end-users are advised to consider this “combo” strategy that involves selling the Nov 6.70 – 6.50 put spread for about 10-cents and buying the Nov 6.95 calls for around 10-1/4-cents for a net initial cost of 1/4-cents. This strategy provides:
- a current net delta of +49%
- favorable margins
- fixed and maximum risk/cost of 22-cents on ANY amount of collapse below 6.50
- unlimited, dollar-for-dollar upside hedge protection above its 6.95 breakeven point at expiration.
Please contact your RJO representative for updated bid/offer quotes on these strategies and good luck on tomorrow’s numbers.
