Posted on Sep 11, 2023, 01:34 by Dave Toth

Unlike the corn market that clearly remains within the throes of a major directional bear trend, Nov23 soybeans have wafted around laterally over the past couple months at the upper-quarter of this year’s range, warranting attention to a bigger move EITHER WAY and possibly fueled by tomorrow’s key crop report. On a short-term basis, the hourly chart above shows the market selling off of late as a result of a bearish divergence in short-term momentum from the extreme upper recesses of this year’s range shown in the daily log chart below. The market’s gross failure to sustain late-Jul’s “breakout” above 30Dec22’s 14.28 high and the extent and impulsiveness of late-Jul/early-Aug’s decline maintains 24-Jul’s 14.35 high as THE high this market needs to recoup to negate a broader peak/reversal count. This said, further erosion below 22-Aug’s 13.39 corrective low remains required to, in fact, break Aug’s uptrend and confirm at least a bigger correction of Aug’s rally attempt if not a resumption of Jul-Aug’s downtrend that preceded it. Per such, we believe this market has identified 13.39 and 14.35 as the key directional triggers heading forward, either of which is in easy striking distance as a result of tomorrow’s crop report. These levels serve as our short-term bull and long-term bear risk parameters.


On a broader basis, the weekly log chart of the Nov contract above shows the market’s position at the extreme upper recesses of the past year-and-a-half’s range following what is only a 3-wave and potentially corrective decline from Apr’22’s 14.48 high to 31May23’s 11.30 low. This structure warns of a prospective resumption of the secular bull trend in the Nov23 contract to at least one more high above 14.48. Herein lies the pivotal importance of 24-Jul’s 14.35 high and our key long-term bear risk parameter.
On an active-continuation basis however, even a spike above 14.35 or 14.48 in the Nov contract would leave the market well below Feb’s 15.56 high the market needs to recoup to render the entire 2022 – 2023 decline from 17.84 a 3-wave and possibly corrective affair that might then re-expose the secular bull to 17.84+ levels. If the market has something this grotesquely bullish in mind, the bull would be expected to BEHAVE LIKE ONE by easily blowing away the 14.48 high in the Nov23 contract and sustaining trendy, impulsive and increasingly obvious upside behavior straight away. A relapse below 13.39 would threaten such a count while subsequent weakness below 08-Aug’s 12.82 low would all but negate it.

Lastly, the monthly log active-continuation chart below shows a multi-quarter peak/reversal process similar to 2011 – 2014’s still arguably well intact that if correct, warns of a multi-year bear market to levels potentially well below $12. And if this is the correct count, we would expect the market to either resume Jul-Aug’s sell-off straight away or, even if the contract recoups 14.48, to fail to sustain those gains.
These issues considered, we believe this market has identified 13.39 and 14.35 as the key directional flexion points heading forward. Traders are advised to toggle directional biases and exposure around these levels commensurate with their personal risk profiles. Per the need for both producers and end-users to protect against a move either way, we discuss below both bull and bear hedge strategies structured around these specific technical levels and elements that, in effect, bet on a MOVE AWAY FROM current 13.50-area levels.

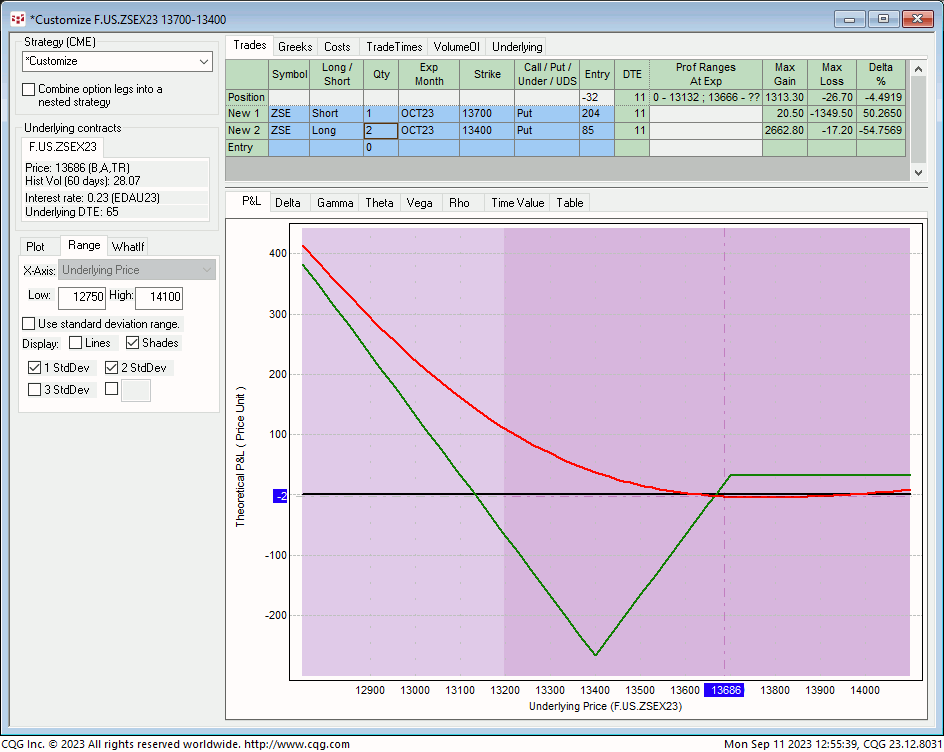
PRODUCER BEAR HEDGE: OCT 13.70 – 13.40 PUT BACK SPREAD
This strategy involves selling 1-unit of the Oct 13.70 Puts around 20-1/2-cents and buying 2-units of the Oct 13.40 Puts around 8-1/2-cents for a net initial CREDIT of 3-1/4-cents and provides:
- a current net delta of -4%
- a retained CREDIT of 3-1/4-cents on any sharp rally above 13.70
- fixed and maximum risk/cost of 26-cents if the underlying Nov contract settles at 13.40 11 days from now on 22-Sep
- virtually unlimited dollar-for-dollar downside hedge protection below its 13.13 breakeven point at expiration.

END-USER BULL HEDGE: OCT 13.60 – 13.90 CALL BACK SPREAD
This strategy is the same but inverted to the producer bear hedge above that involves selling 1-unit of the Oct 13.60 Calls around 23-1/2-cents and buying 2-units of the Oct 13.90 Calls around 11-3/4-cents for a net initial cost of “even”. This strategy provides:
- a current net delta of +10%
- zero risk/cost on any sharp decline below 13.60
- fixed and maximum risk/cost of 30-cents if the underlying Nov contract settles at 13.90 11 days from now on 22-Sep
- virtually unlimited dollar-for-dollar upside hedge protection above its 14.20 breakeven point at expiration.
Please contact your RJO representative for updated bid/offer quotes on these strategies and good luck on tomorrow’s numbers.

