In yesterday’s Corn Technical Blog, we discussed the compelling combination of:
- waning upside momentum from
- the extreme upper recesses of the range that dates from last summer’s high
- the prospect of a complete or completing Elliott sequence amidst
- historically frothy levels in our RJO Bullish Sentiment Index.
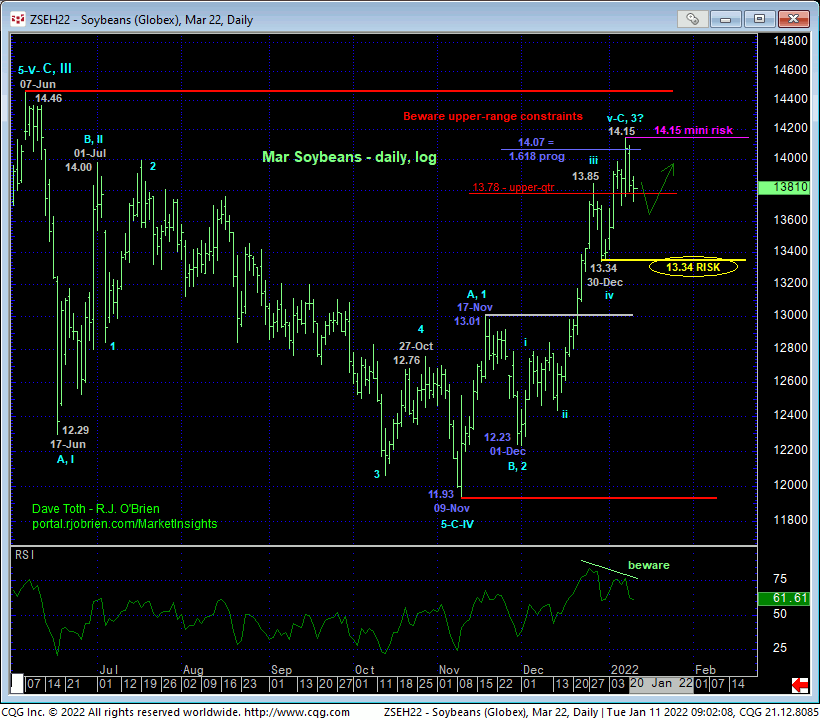
The hourly, daily and weekly charts of beans above and below show virtually identical technical elements weighing against the clear and present uptrend that has yet to be broken.
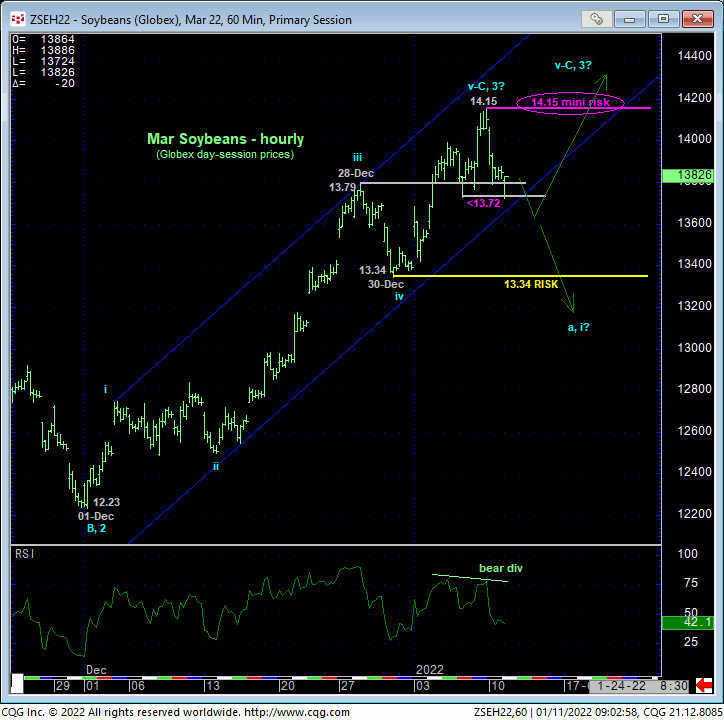
The hourly chart above shows today’s mini momentum failure below last Thur’s 13.72 minor corrective low and mini risk parameter that defines Fri’s 14.14 high as one of developing importance and our new mini risk parameter from which shorter-term traders with tighter risk profiles can objectively base non-bullish decisions like long-covers and cautious bearish punts. As we cannot conclude a broader peak/reversal threat from proof of just smaller-degree weakness, it would be premature to conclude anything more than just a slightly larger-degree correction within the past couple months’ impressive rally from 09-Nov’s 11.93 low. Nonetheless, a recovery above 14.15 is now required to resurrect this bull and for shorter-term traders to incur a whipsaw and get back on the bullish horse.
From a longer-term perspective, 30-Dec’s larger-degree corrective low at 13.34 discussed in Fri’s Technical Blog remains intact as our longer-term bull risk parameter the market needs to break to confirm a bearish divergence in daily momentum and of a sufficient scale to, in fact, break the uptrend from at least 01-Dec’s 12.23 low and perhaps the rally from 09-Nov’s 11.93 low. Against the peak/reversal-threat elements listed above, a failure below 13.34 expose a larger-degree correction or reversal of the extensive rally from 09-Nov’s 11.93 low. And with tomorrow’s hugely important crop reports, we won’t have to look far for a catalyst to either reinforce and drive this uptrend sharply higher or peak it out. In effect, we believe the market has identified 13.34 and 14.15 as the key directional triggers heading forward around which traders can toggle directional biases and exposure commensurate with their personal risk profiles.
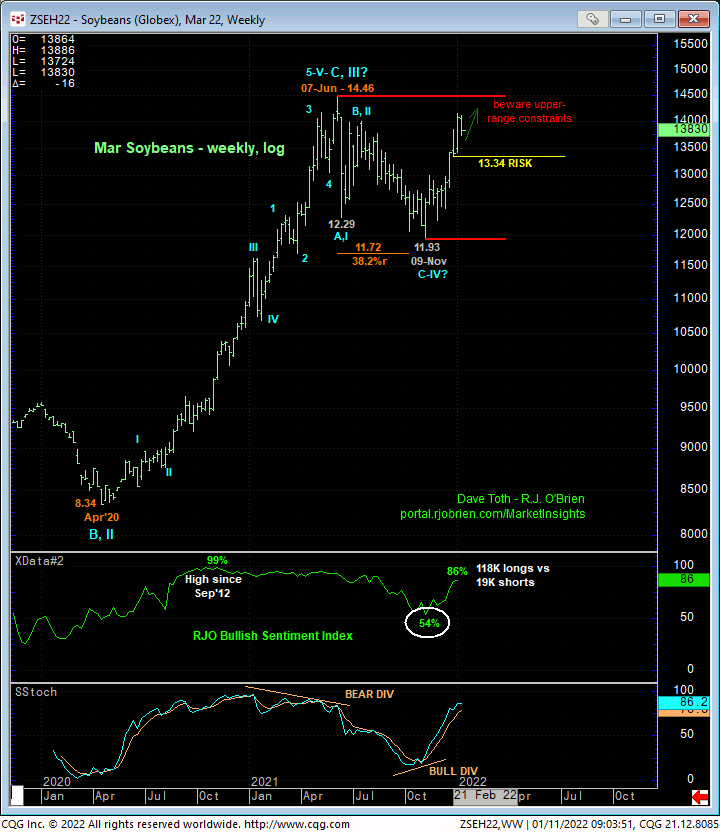
The weekly log chart below shows the understandable resurgence to the bull side by the Managed Money community as our RJO Bullish Sentiment Index has swelled to an 86% level that hasn’t been seen since last summer, when the market was similarly wafting around and then failed miserably from near 07-Jun’s 14.46 high. The combination of this current frothiness and today’s minor momentum failure provides a very early indication of pending weakness that could morph into a significant, if intra-seven-month-range correction or reversal lower. Further weakness below 13.34 will confirm this threat and expose indeterminable losses thereafter while a recovery above 14.15 is required to mitigate this threat. This technical condition is similar to last Jul’s before the market lost nearly 15% over the next four months.
These issues considered, today’s admittedly short-term mo failure below 13.72 is sufficient for shorter-term traders with tighter risk profiles to move to at least a neutral/sideline position. Cautious bearish punts are OK, but the risk is to 14.15. We prefer to wait for proof of labored, corrective behavior on a scant recovery attempt for a preferred risk/reward selling opportunity. A bullish policy and exposure remain advised for longer-term commercial players with failure a below 13.34 required to neutralize bullish exposure immediately to circumvent the depths unknown of a larger-degree correction or reversal lower. In lieu of such weakness, further and possibly accelerated gains should not surprise. Given the grease coming from tomorrow’s key crop reports, we discuss what we believe are conservative but favorable risk/reward strategies for both producers and end-users to hedge against moves adverse to their cash exposure.
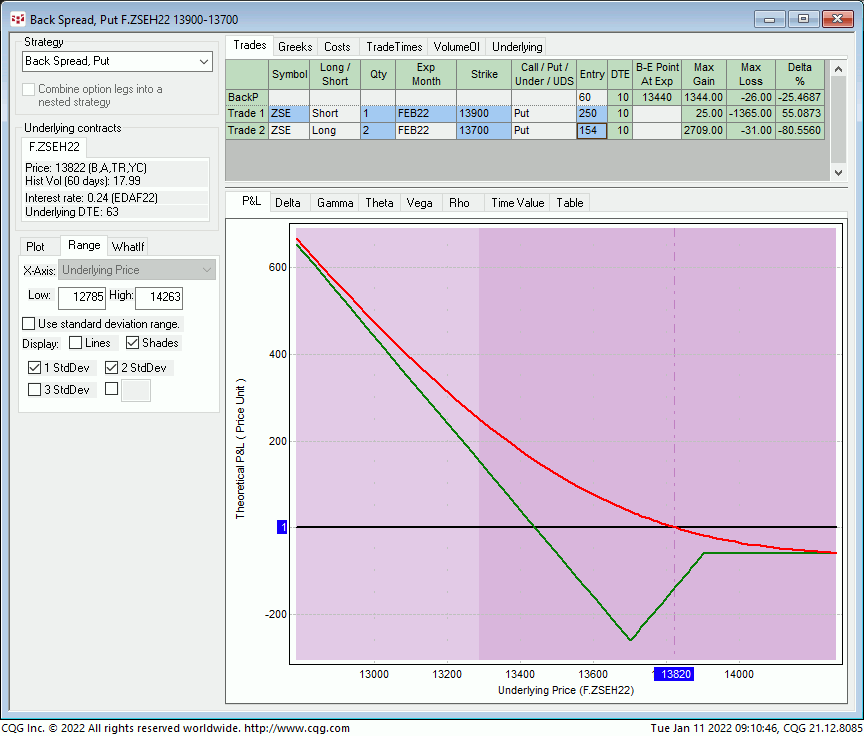
PRODUCER BEAR HEDGE: FEB 13.90 – 13.70 PUT BACK SPREAD
As tomorrow’s crop reports have historically been some of the most important and market-moving reports of the entire year, we’re structuring both of these strategies from the key technical elements and levels cited above and for a MOVE AWAY FROM current 13.80-area prices. To safely hedge against a surprise move lower without incurring considerable risk of the clear and present bull trend’s continuance, producers are advised to consider the Feb 13.90 – 13.70 Put Back Spread. This spread involves selling 1-unit of the Feb 13.90 Puts for around 25-cents and buying 2-units of the Feb 13.70 Puts around 15-1/2-cents for a net cost of around 6-cents. This strategy provides:
- a current net delta of -25%
- favorable margins
- a maximum risk/cost of 6-cents on ANY continuation of the current rally above 13.90
- maximum risk/cost of 26-cents if the underlying Mar contract settles at 13.70 on expiration of the Feb options 10 days from now on 21-Jan
- virtually unlimited, dollar-for-dollar downside hedge protection below its 13.44 breakeven point at expiration.
If, by the end of the week or early next week, the underlying market doesn’t conform with the rationale for this strategy by MOVING SUBSTANTIALLY AWAY FROM current 13.80-area prices, this spread should be covered at what should be a relatively small loss as time decay will increasingly work against it.
END-USER BULL HEDGE:
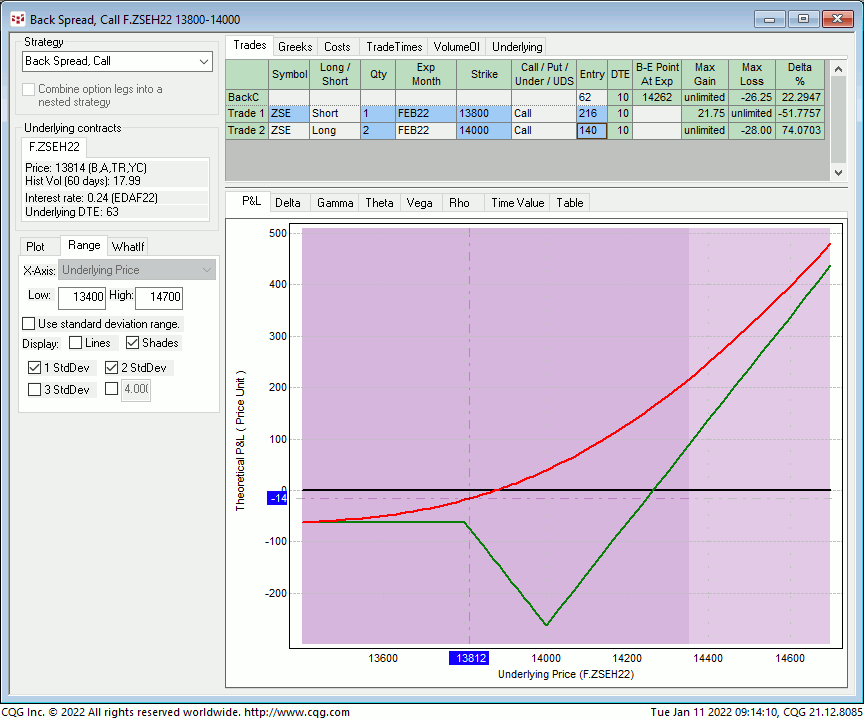
Similarly but inversely, the Feb 13.80 – 14.00 Call Back Spread presents a cautious but effective way for end-users to protect against an acceleration of the current uptrend given the technical threats to it listed above. This strategy involves selling 1-unit of the Feb 13.80 Calls for around 21-3/4-cents and buying 2-units of the Feb 14.00 Calls around 14-cents for a net cost of about 6-1/4-cents. This strategy provides:
- a current net delta of +22%
- favorable margins
- fixed, maximum risk/cost of 6-1/4-cents on ANY reversal below 13.80
- fixed, maximum risk/cost of 26-1/4-cents if the underlying Mar contract settles at 14.00 at expiration 10 days from now on 21-Jan
- unlimited, dollar-for-dollar upside hedge protection above its 14.26 breakeven point at expiration.
Please contact your RJO representative for updated bid/offer quotes on these strategies and good luck on tomorrow’s numbers.
