Posted on Oct 14, 2022, 07:42 by Dave Toth
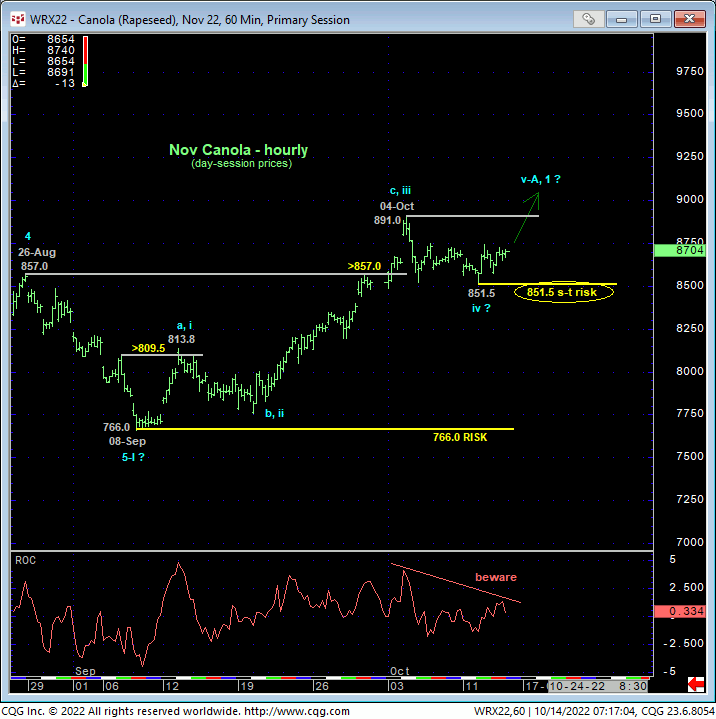
On the heels of mid-Sep-to-early-Oct’s steeper, accelerated, 3rd-wave-looking recovery, the past week-and-a-half’s boringly lateral chop is first considered a corrective/consolidative event that warns of a continuation of the uptrend that preceded it to new highs above 04-Oct’s 891.0 high. This count remains consistent with our broader base/correction/recovery count introduced in 13-Sep’s Technical Blog following that day’s bullish divergence in short-term momentum above 07-Sep’s 809.5 minor corrective high detailed in the hourly chart below.
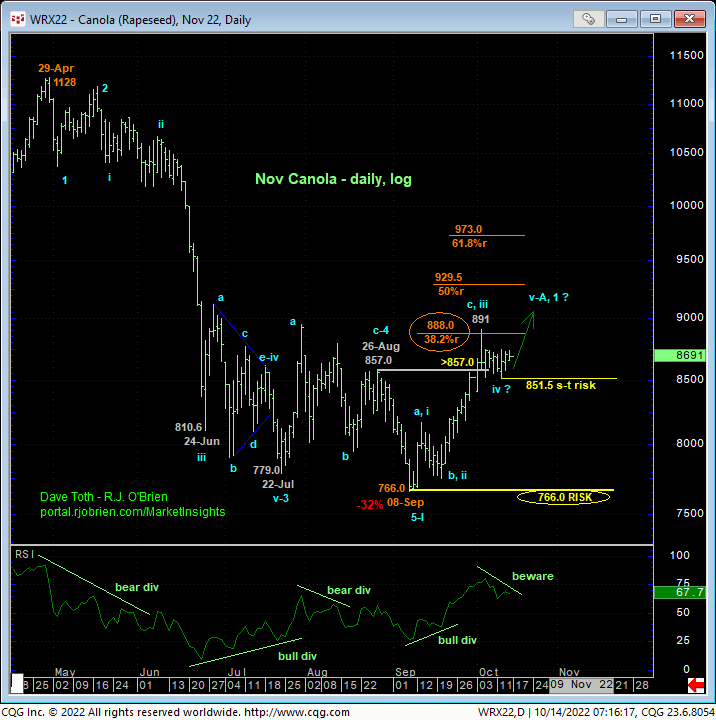
The important takeaway from this month’s lateral, sleepy price action is the definition of Wed’s 851.5 low as the end or lower boundary of a suspected 4th-Wave correction. A failure below 851.5 will confirm a bearish divergence in daily momentum and defer or threaten a bullish count enough to warrant non-bullish decisions like long-covers. A failure below 851.5 will not necessarily negate a broader bullish count, but it will threaten it enough to warrant defensive measures as the next pertinent technical levels below 851.5 are 13-Sep’s prospective minor 1st-Wave high at 813.8 and obviously 08-Sep’s 766.0 low. And making non-bullish decisions “down there” is sub-optimal to say the least. Per such, both short- and longer-term commercial traders are advised to pare or neutralize bullish exposure on a failure below 851.5, acknowledging and accepting whipsaw risk- back above 04-Oct’s 891.0 high- in exchange for much deeper and sub-optimal nominal risk below 766.0.


On a broader scale, the daily log scale chart above shows the developing potential for a bearish divergence in daily momentum that will be considered confirmed below 851.5. This chart also shows the past month’s recovery thus far stalling in the immediate neighborhood of the (888.0) Fibonacci minimum 38.2% retrace of Apr-Sep’s entire 1128 – 766 decline). COMBINED with a failure below 851.5, traders would then need to be concerned with at least a larger-degree correction pf the past month’s rally and possibly a resumption of Apr-Sep’s major downtrend.
Until and unless the market fails below 851.5 however, we would remind longer-term players of the key elements on which our bullish count is predicated:
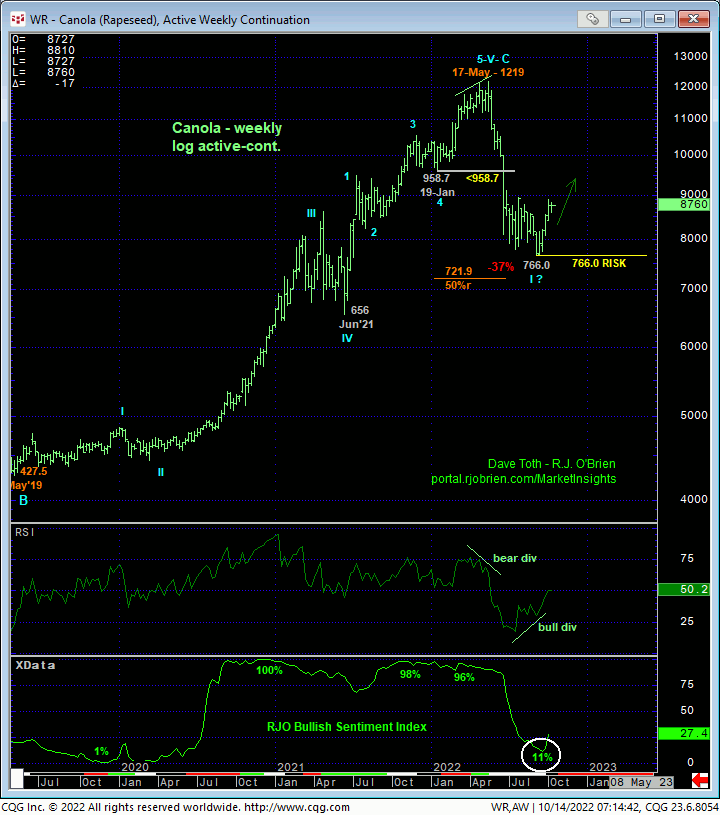
- a confirmed bullish divergence in WEEKLY momentum (below) amidst
- an historically low 11% reading in out RJO Bullish Sentiment Index and
- a textbook complete and major 5-wave Elliott sequence down from 29-Apr’s 1128 high to 08-Sep’s 766.0 low.
Thus far, the market is only a month into correcting a 4-MONTH, 32% drawdown, so further and possibly protracted gains remain well within the bounds of a major (suspected 2nd-Wave) correction of Apr-Sep’s decline within an even more massive PEAK/reversal process from 17-May’s 1219 high on an active continuation basis below.
These issues considered, a bullish policy and exposure remain advised with a failure below 851.5 required to defer or threaten this call enough to warrant moving to a neutral/sideline position. In lieu of such weakness, we anticipate a continuation of the past month’s rally to new highs and potentially significant gains above 891.0.


