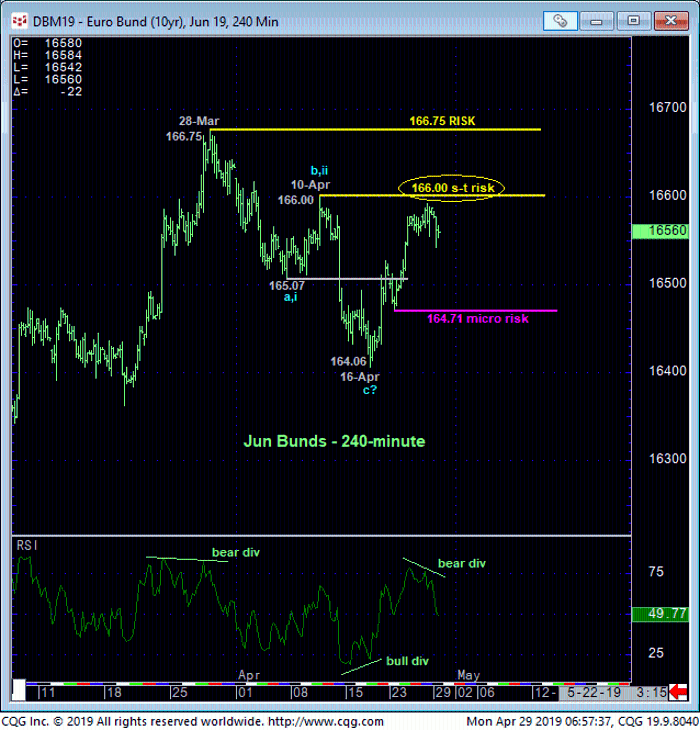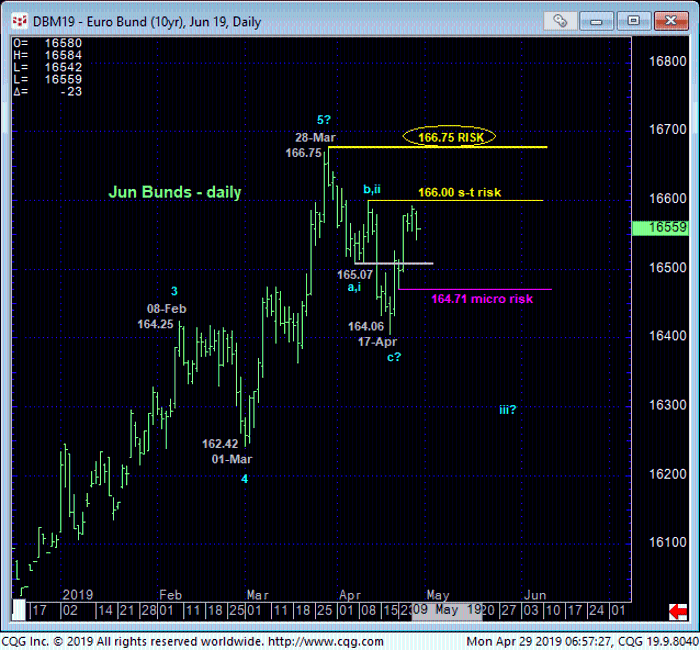
In 18-Apr’s Technical Blog we acknowledged that day’s bullish divergence in very short-term momentum as defining 16-Apr’s 164.06 low as one of developing importance while also maintaining 10-Apr’s 166.00 corrective high as the short-term risk parameter the market needed to recoup to render Mar-Apr’s sell-off attempt from 166.75 to 164.06 a 3-wave and thus corrective structure that would warn of a resumption of Oct-Mar’s major uptrend that preceded it. The 240-min chart below shows that subsequent gains last week left 23-Apr’s 164.71 low in their wake as a very minor corrective low and micro risk parameter from which non-bearish decisions like short-covers and cautious bullish punts can now be objectively rebased and managed.
By the same token however, the market has yet to break 10-Apr’s 166.00 high needed to raise the odds that the early-Apr setback was “just” a correction ahead of accelerated gains. Additionally, overnight’s slippage confirms a bearish divergence in very short-term momentum that highlights this 166.00-area resistance and short-term risk parameter all the more.

Now only a glance at the 240-min chart above or daily chart below is needed to see Mar-Apr’s setback as only a 3-wave affair thus far. “Theoretically” then and until the market weakens below at least 164.71, we should not be surprised by a poke above our short-term risk parameter at 166.00and subsequent accelerated gains to new highs above 166.75. More realistically however, the market’s current position is smack ibn the middle of the past month’s 166.75 – 164.06-range where traders should approach the odds of aimless whipsaw risk as higher and move to a more conservative approach to risk assumption we believe is warranted under such range-center circumstances. In effect, the market remains in the middle of the not uncommon correction-vs-reversal debate initiated with 03-Apr’s bearish divergence in momentum.


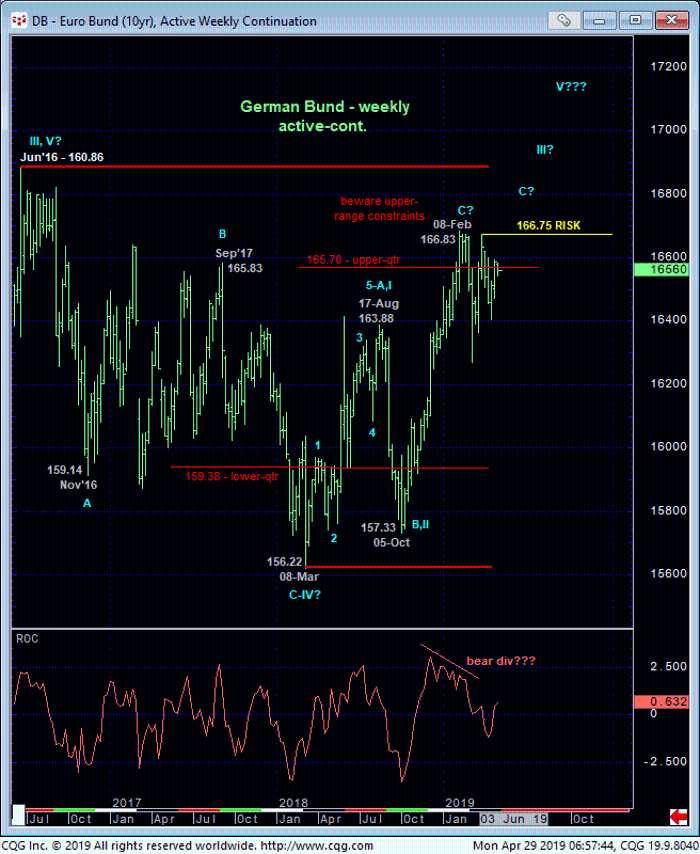
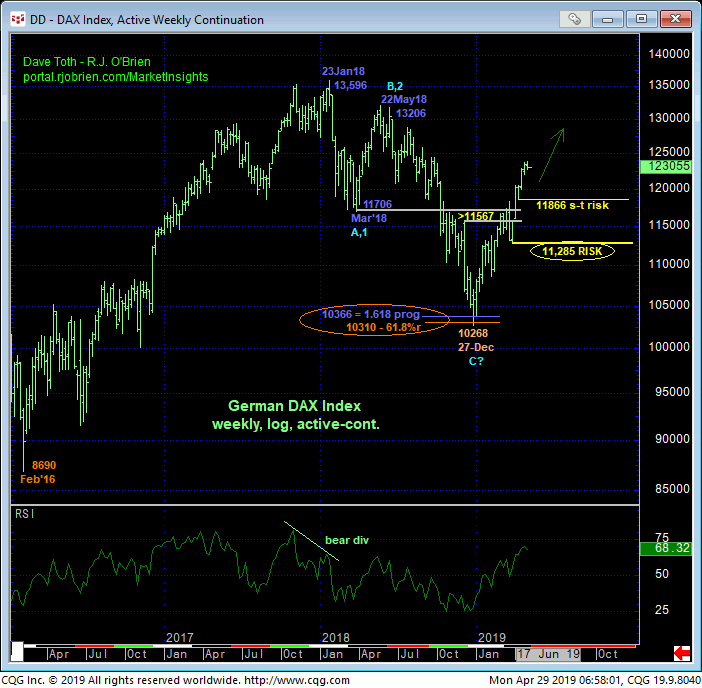
Complicating the challenge is the bund market’s rejection thus far of the upper-quarter resistance of the past THREE YEAR range shown in the weekly active-continuation chart above while the DAX Index has, like our Y.S. stocks indices, staged an impressive reversal since the holidays. Indeed, the extent and impulsiveness of this recovery leaves all of 2018’s decline from 13,596 to 10,268 in its wake as a 3-wave and thus corrective affair that warns of a resumption of the secular bull market that preceded it. The market’s rejection of a pair of Fibonacci retracement and progression relationships in the immediate area of 27Dec18’s 10.268 low would seem to reinforce this longer-term bullish count that, if the inverse relationship between the S&P and Treasuries is any indication, would not surprise by downward pressure on the bund.
Now, UNlike the U.S. equity indies, the DAX is quite a ways away from 23Jan18’s all-time high and could remain trapped, consolidating within the past 16-month range indefinitely while bunds continue their 6-month rally, so it really still comes down to which side of the past month’s range in the bunds this market wants to flop to.
These issues considered, traders can play the bunds from either side with an emphasis on flexibility to either directional outcome and adherence to technical discipline and short-term but objective risk parameters at 166.00 and 164.71. A cautious bullish policy is OK as long as the market sustain levels above 164.71, with further gains above 166.00 reinforcing this view and exposing a run at 28-Mar’s 166.75 high and above. By the same token however, a cautious bearish stance is likewise OK with a recovery above 166.00 negating this call and warranting its cover. A relapse below 164.71 will reinforce this view and raise the odds of a broader peak/reversal count to eventual new lows below 164.06.


