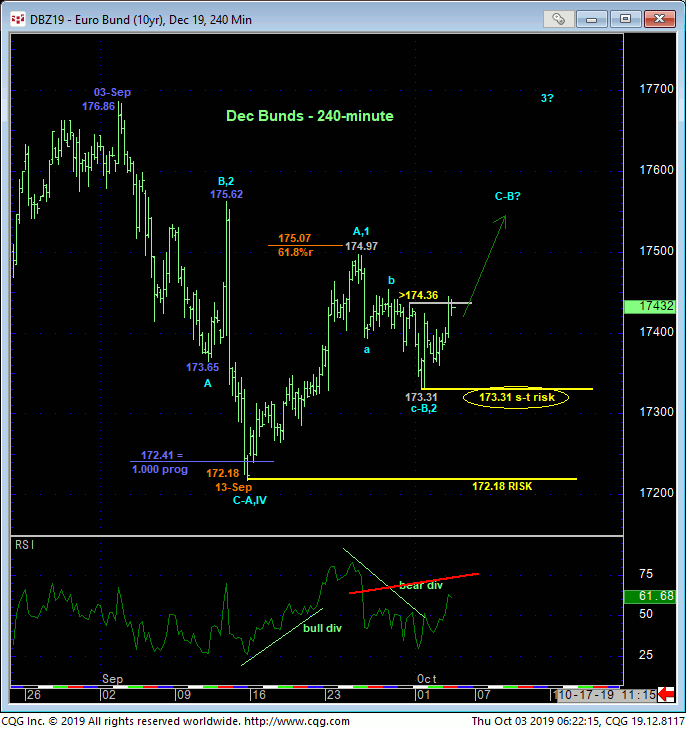
The market’s recovery overnight above Mon’s 174.36 high and our short-term risk parameter discussed in Tue’s Technical Blog renders the recent relapse attempt from 24-Sep’s 174.97 high a 3-wave affair as labeled in the 240-min chart below. Left unaltered by a relapse below Tue’s 173.31 low, this 3-wave setback is considered a corrective/consolidative event that warns of a resumption of mid-Sep’s 172.18 – 174.94 uptrend that preceded it. In this regard this 173.31 level serves as our new short-term risk parameter from which shorter-term traders with tighter risk profiles can objectively rebase and manage the risk of a resumed bullish policy.
As the market remains deep within the bowels of the past month’s range, it’s indeterminable at this juncture whether the recovery from 13-Sep’s 172.18 low is just (the B-Wave) part of a consolidation that’s got further lateral chop to go OR the (5th-Wave) resumption of the secular bull trend. If the market has the latter, bullish count in mind, then we would expect it to sustain trendy, impulsive behavior upward above corrective lows like 173.31.


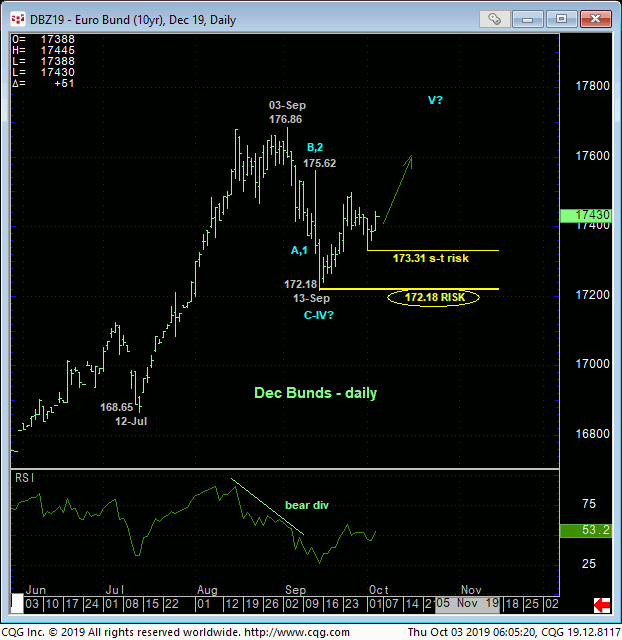
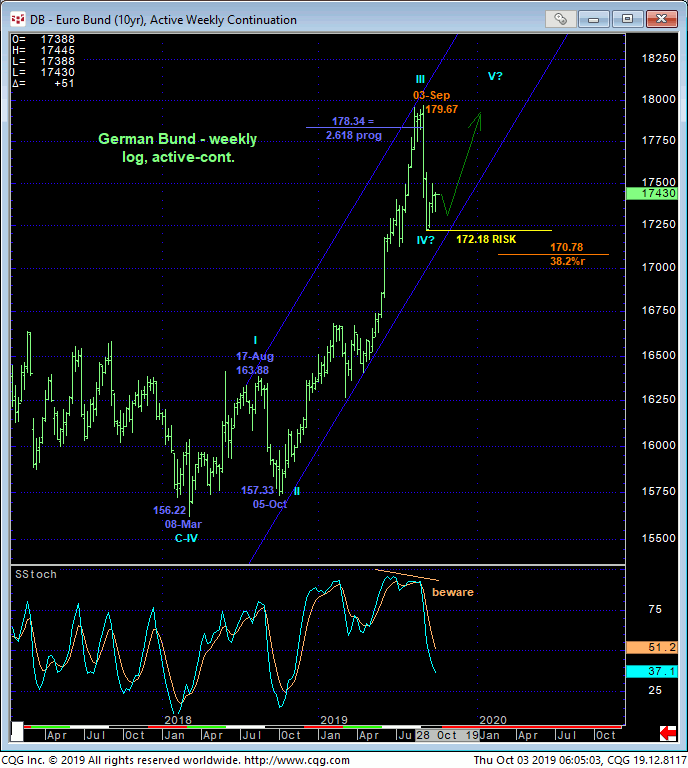
On a broader scale, early-to-mid-Sep’s setback was not unimpressive, but against the backdrop of the secular bull market this setback was well within the bounds of a mere (4th-Wave) correction within what we believe is a still-developing uptrend to at least one more round of new (5th-Wave) highs above 03-Sep’s 176.86 high in the Dec contract. As an interesting side note, on this weekly log scale active-continuation basis below, Sep’s 179.76 – 172.18 was virtually identical in length (i.e. 1.000 progression) to Aug-Oct’18’s preceding 163.88 – 157.33 (2nd-Wave) correction. We’re not going to conclude a bullish (4th-Wave) correction from this derived Fibonacci fact, but it would seem to be more consistent with such a count. What we ARE going to conclude are the market-defined lows and support at 173.31 and certainly 13-Sep’s 172.18 that serve as reliable and specific short- and longer-term risk parameters from which a bullish policy and exposure can be objectively rebased and managed.
These issues considered, a bullish policy remains advised for longer-term players with a failure below 173.31 required to pare exposure to more conservative levels and subsequent weakness below 172.18 to jettison the position altogether ahead of a heightened concern for a more protracted correction or reversal lower. Shorter-term traders whipsawed out of bullish exposure following Mon’s bearish divergence in short-term mo are advised to resume a bullish policy at-the-market (174.40 OB) with a failure below 173.31 required to negate this call and warrant its cover. In lieu of a relapse below at least 173.31, we anticipate at least a break above 25-Sep’s 174.97 high and possibly a resumption of the secular bull to new highs above 176.86.


