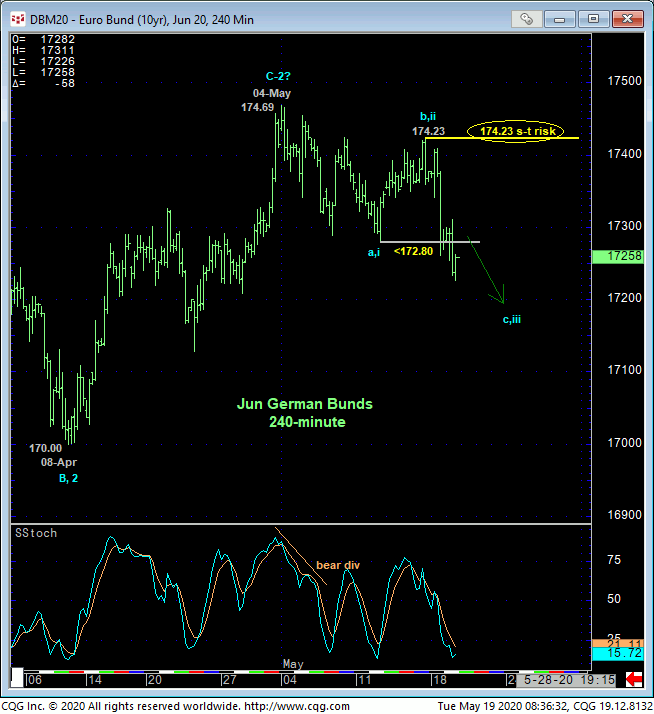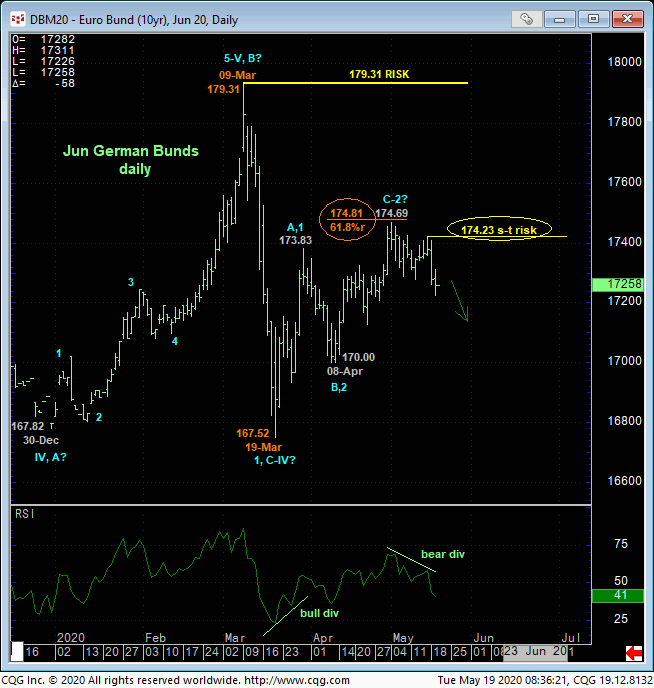

Yesterday and overnight’s break below 12-May’s 172.80 initial counter-trend low confirms a bearish divergence in daily momentum (below) and reaffirms our peak/reversal-threat count introduced in 07-May’s Technical Blog. This resumed weakness leaves Fri’s 174.23 high in its wake as the latest smaller-degree corrective high the market must now sustain losses below to maintain a more immediate bearish count. Its failure to do so will render the sell-off attempt from 04-May’s 174.69 high a 3-wave and thus corrective affair that would then re-expose the broader 2-month uptrend. Per such, this 174.23 level serves as our new short-term risk parameter from which non-bullish decisions like long-covers and bearish punts can be objectively re-based and managed.

This tight but objective bear risk parameter at 174.23 will prove handy as, from a longer-term perspective, it’s debatable what’s correcting what. Looking at the daily chart above, the recovery from 19-Mar’s 167.52 low to 04-May’s 174.69 high is, thus far at least, about as 3-wavish and corrective as it gets. The Fibonacci fact that this recovery retraced 61.8% of Mar’s 179.31 – 167.52 meltdown would seem to reinforce this bear market correction scenario.
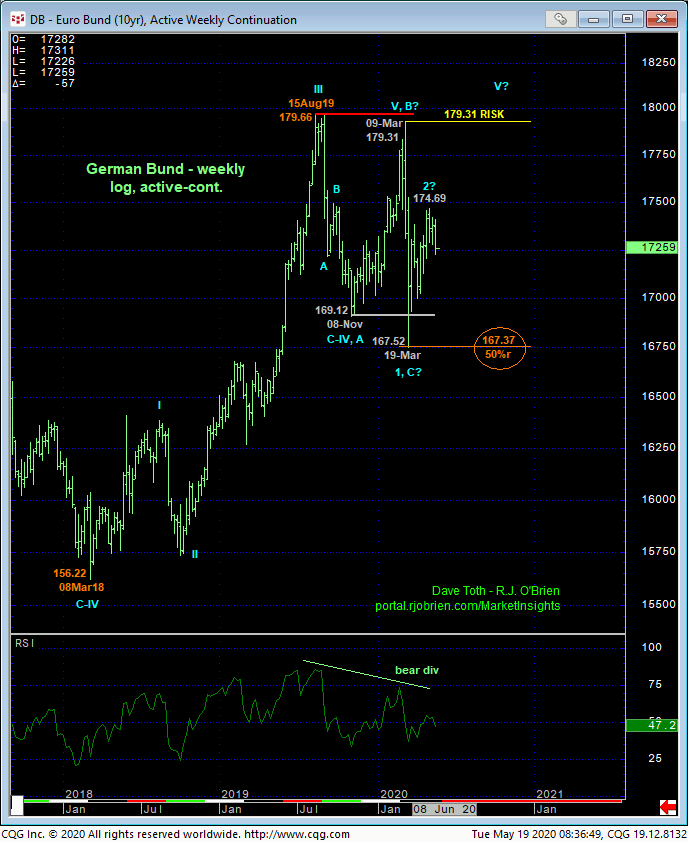
This said, from an even longer-term perspective shown in the weekly log chart below, Aug’19 – Mar’20’s 179.66 – 167.52 decline is about as 3-wavish and corrective as it gets. And the Fibonacci fact that this sell-off attempt retraced an exact 50% of Mar’18 – Aug’19’s 156.22 – 179.66 rally would seem to reinforce this bull market correction scenario.
So what’s correcting what?
All the Elliott and Fibonacci mumbo-jumbo aside, the simplest fact of the technical matter is that the market’s currently trading in the middle of the middle-half bowels of a 179.66-to-167.52 range where the odds of aimless whipsaw risk are approached as higher, warranting a more conservative approach to risk assumption. Such an approach requires identifying tighter but objective risk parameters like 174.23. The odds of hitting a directional home run from current range-center conditions and levels are poor. The odds of getting whipsawed are higher. Traders are advised to acknowledge this predicament and try to hit singles. And to also acknowledge that a decline to sub-167.52 levels OR a resumption of the secular bull to 179.66+ levels are possible. The next bigger move may hinge around Thur’s 174.23 high and short-term risk parameter.
In sum, a cautious bearish policy and exposure remain advised with a recovery above 174.23 required to negate this specific call and tilt the intra-range directional scales higher. Until and unless such 174.23+ strength is shown, further and possibly accelerated losses should not surprise.


