Posted on Jan 05, 2024, 07:15 by Dave Toth
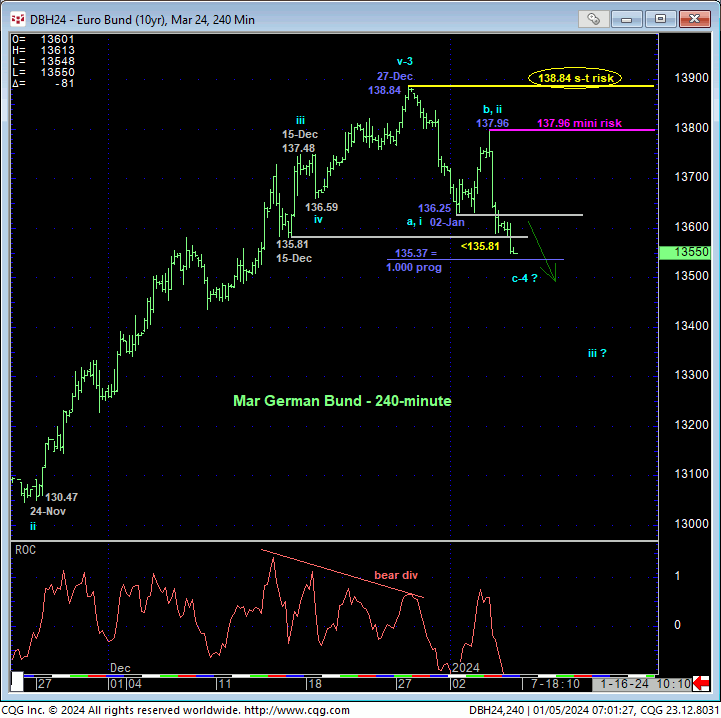
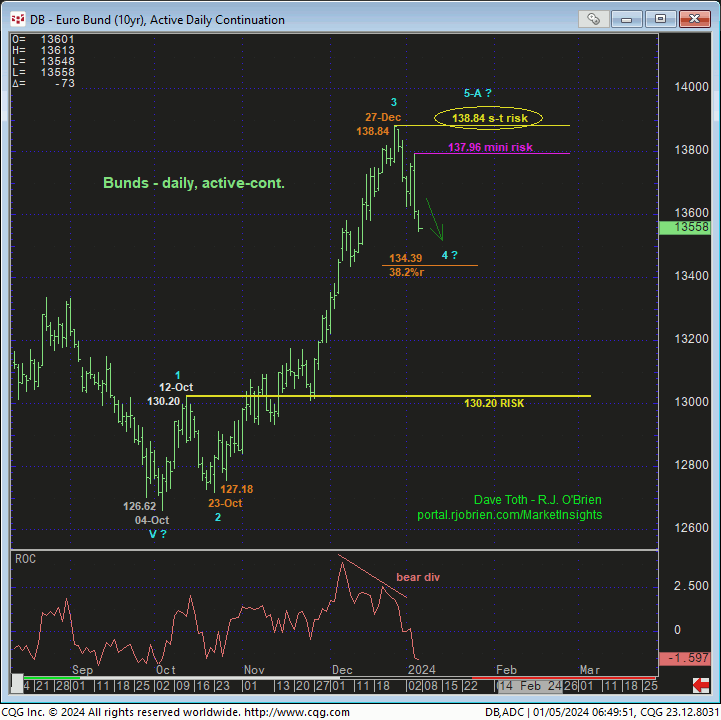
Yesterday’s break below 02-Jan’s 136.25 initial counter-trend low reaffirms our peak/correction count introduced in 02-Jan’s Technical Blog and leaves two highs and resistance in its wake at 137.96 and 138.84 that it now must recoup to raise the odds and then confirm the sell-off attempt from 27-Dec’s 138.84 high is a 3-wave and thus corrective event within a base/reversal count that could be major in scope. Per the counts labeled in the 240-min chart, we know that the past couple days’ decline from 137.96 can be one of only two things: the completing c-Wave of a (prospective 4th-Wave) correction ahead of a (5th-Wave) resumption of the rally from 04-Oct’s 1126.62 low OR a more dramatic 3rd-Wave of a more protracted correction or reversal lower. Per such, we’re identifying 137.96 and 138.84 as our new mini and short-term parameter from which non-bullish decisions like long-covers and cautious bearish punts can be objectively based and managed.
IF the corrective bullish count is correct, then we would expect the market to arrest this relapse with a countering bullish divergence in momentum SOON, perhaps around the (135.37) 1.000 progression of 27-Dec-to-02-Jan’s initial counter-trend break from 138.84 to 136.25 subtracted from yesterday’s 137.96 high. Until/unless such a countering bullish divergence in mo stems this developing slide, there is no way to know (alternative 3rd-Wave) depths of this decline.

On a broader scale, the reason we’ve advised even longer-term institutional players to neutralize bullish exposure on a failure below 15-Dec’s 135.81 larger-degree corrective low is the extent and uninterrupted nature of 23-Oct-to-27-Dec’s (suspected 3rd-Wave) rally that left little in the way of former battlegrounds that might now be looked to as objective and practical support and a longer-term bull risk parameter. Indeed, to truly negate the impulsive integrity of a suspected 5-wave rally up from 04-Oct’s 126.62 low, a break of 12-Oct’s 130.20 1st-Wave high is required. And this 130.20 level as a long-term bull risk parameter is simply too impractical following the extent of Oct-Dec’s rally. Per such, we’ve advised longer-term players to approach directional risk more conservatively and acknowledge and accept whipsaw risk back above 138.84 in exchange for much steeper nominal risk below 130.20.
IF the current setback is “only” a (4th-Wave) correction as we suspect, the market would be expected to arrest this relapse, we believe, in fairly short order with a countering bullish divergence in short-term momentum needed to reject/define a more reliable low and support from which the risk of resumed bullish policy and exposure can then be objectively rebased and managed. In lieu of such a divergence, the market’s downside potential is considered indeterminable and potentially extreme.

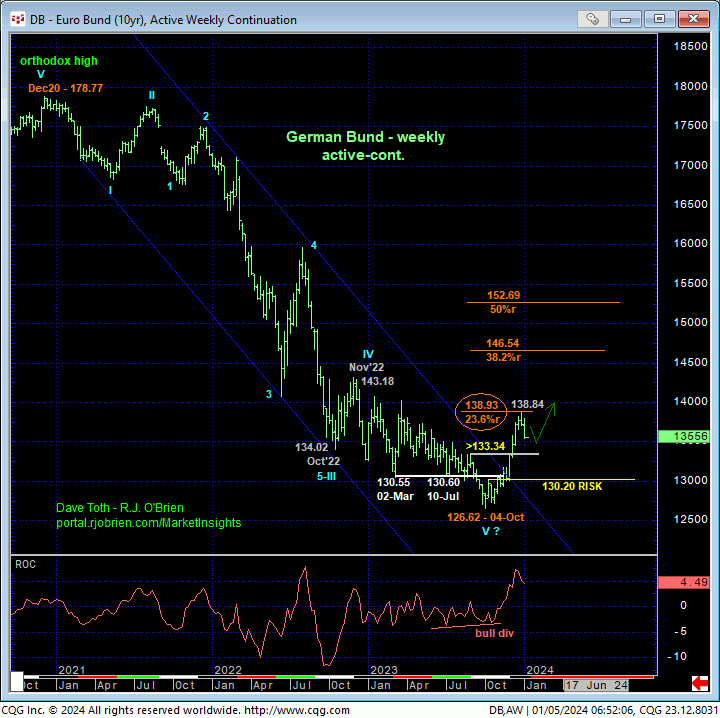
On an even broader weekly scale below, we don’t need to rehash the elements that warn of base/reversal-threat environment that could be major in scope, possibly spanning quarters and retracing to the 146-to-152-handle areas or higher. It is interesting to note however, especially given a confirmed bearish divergence in daily momentum, that last week’s 138.84 high was only nine ticks away from the (138.93) Fibonacci minimum 23.6% retrace of the entire 3-YEAR secular bear market from Aug’20’s 178.77 orthodox high to 04Oct23’s 126.62 low.
These issues considered, both short- and longer-term traders have been advised to move to a neutral/sideline or even a cautiously bearish stance with a recovery above at least 137.96 required to threaten this call and re-expose the new major bull trend. In lieu of such strength, further and possibly accelerated losses straight away should not surprise.


