JUN BUNDS
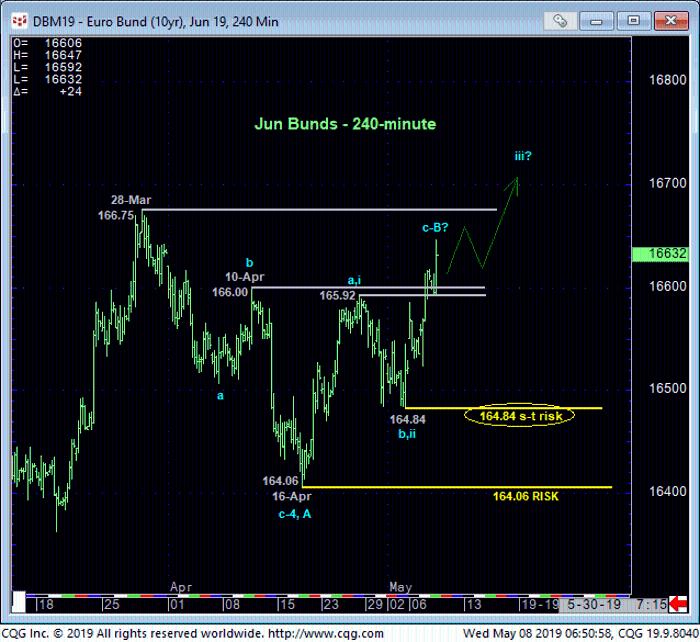
Yesterday and overnight’s recovery above 10-Apr’s 166.00 high and our short-term risk parameter renders Mar-Apr’s sell-off attempt from 166.75 to 164.06 a 3-wave affair as labeled in the 240-min chart below. Left unaltered by a relapse below 16-Apr’s 164.06 low, this 3-wave setback is considered a corrective/consolidative affair that warns of a resumption of Oct-Mar’s major uptrend that preceded it. While 28-Mar’s 166.75 high remains intact as resistance, we have to acknowledge the prospect for further intra-range lateral consolidation, but former 166.00-to-165.90-area resistance over the past few weeks, since broken, is now expected to hold as new near-term support per any more immediate bullish count, like a breakout above that 16.75 high.
This week’s resumption of the mid-Apr rally leaves 03-May’s 164.84 low in its wake as the latest smaller-degree corrective low the market is now minimally required to fail below to negate a more immediate bullish count. In this regard this 164.84 low is considered our new short-term risk parameter from which shorter-term traders can objectively rebase and manage the risk of a still-advised bullish policy.
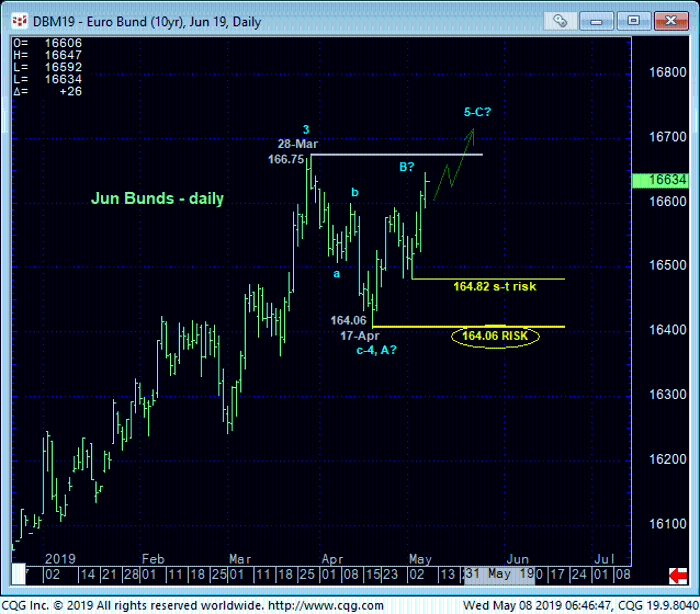
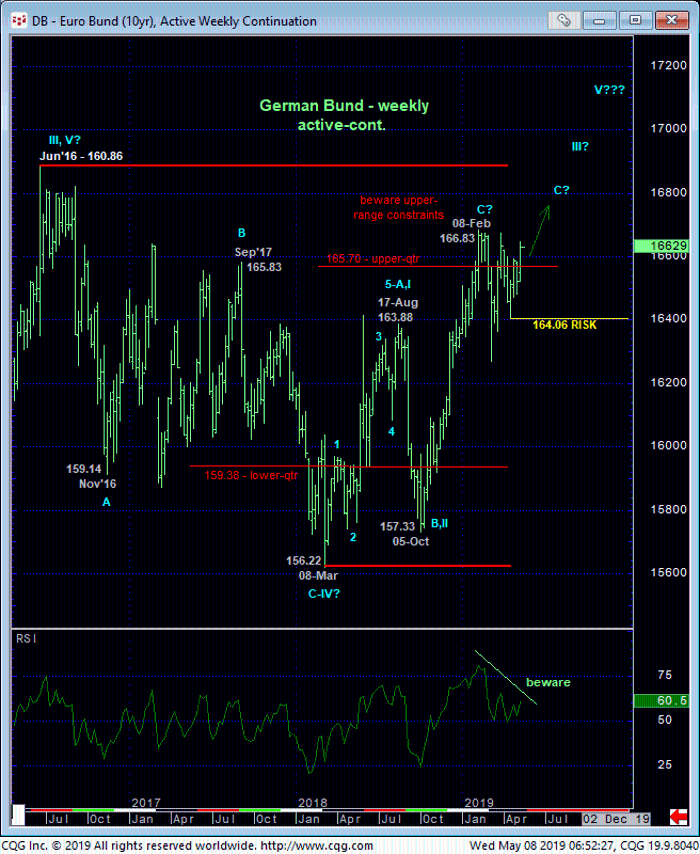
Against the backdrop of the major uptrend shown in both the daily chart above and weekly active-continuation chart below, Mar-Apr’s setback sticks out like a sore thumb as a prospective correction following this week’s further recovery that renders 17-Apr’s 164.06 low as an obvious and major support and long-term risk parameter to a resumed bullish policy.
From an even longer-term perspective, the weekly chart below reminds traders of the market’s position in the upper-quarter of a 160.86-to-156.22-range that has encapsulated it for the past three years. If there’s a time and place to be watchful for a momentum failure that could once again expose a major relapse, it is from current 166+ levels. And herein lies the crucial importance of larger-degree corrective lows and key risk parameters like 164.06. In lieu of weakness below at least 164.84 and preferably below 164.06 however, we anticipate at least one more round of new highs above 166.75. And once above that high, there’s really no way to know of the market’s remaining upside potential beyond that point.
These issues considered, a bullish policy is advised with a relapse below 164.84 required to negate this specific call and warrant its cover. In lieu of such weakness, further and possibly accelerated gains to new highs above 166.75 are expected.
JUN 10-Yr T-NOTES
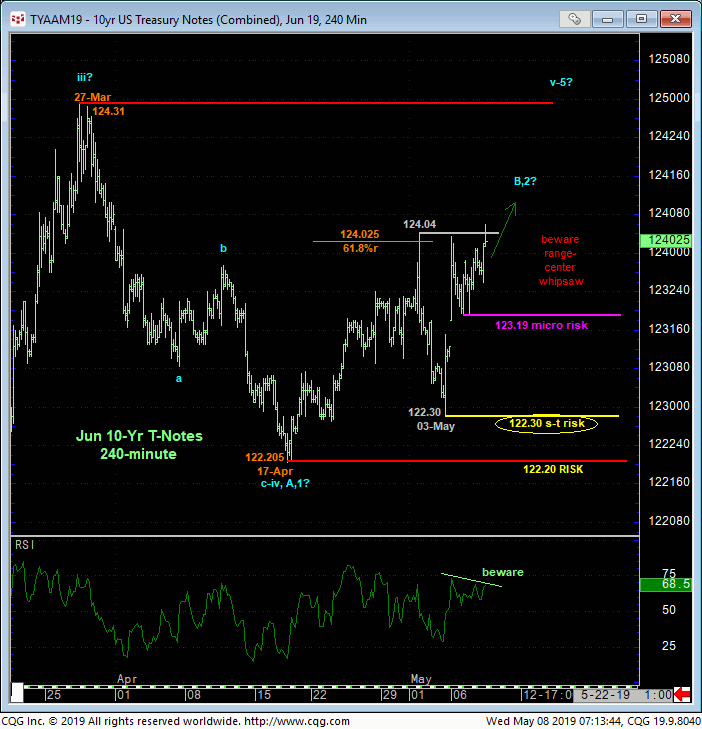
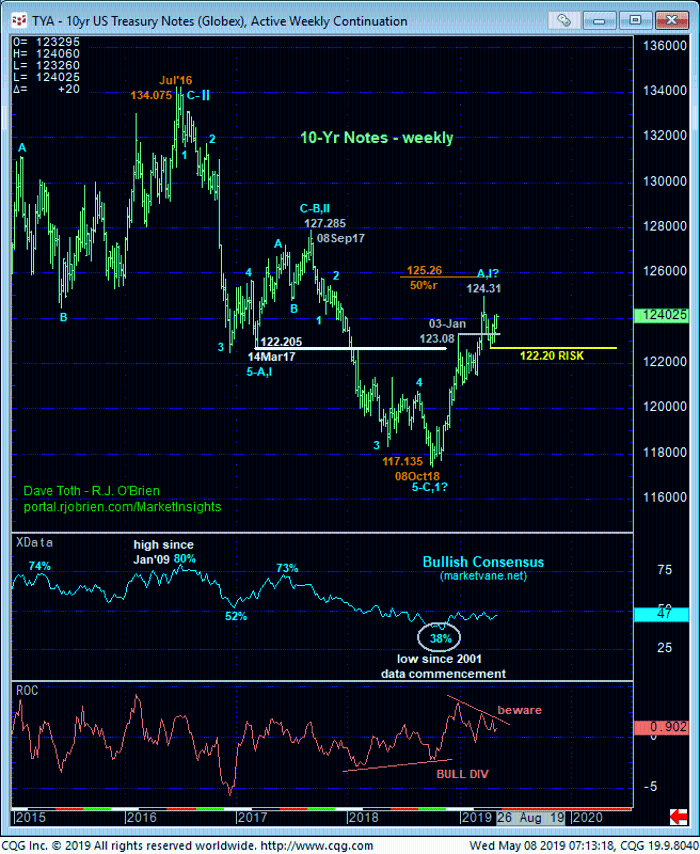
For most intents and purposes the technical construct of the T-note market is identical to those detailed above for bunds. This week’s recovery above 01-May’s 124.04 high and our short-term risk parameter not only confirms at least the intermediate-term trend as up, it renders Mar-Apr’s sell-off attempt from 124.31 to 122.205 a 3-wave and thus corrective structure as labeled in the 240-min chart above and daily chart below. Left unaltered by a relapse below 17-Apr’s 122.205 low and new key long-term risk parameter, this count warns of a resumption of Oct-Mar’s major uptrend that preceded it to new highs above 125.00.
On a shorter-term basis today’s continued recovery leaves smaller-degree corrective lows in its wake at 123.19 and 122.30 that can be used as micro- and short-term bull risk parameters from which shorter-term traders can objectively rebase and manage the risk of a resumed bullish policy. These tighter but objective risk parameters may come in handy given that the market remains deep within the past month-and-a-half’s range that could still produce a lot of aimless whipsaw risk. In lieu of weakness below at least 123.19 however, further and possibly accelerated gains should not surprise.
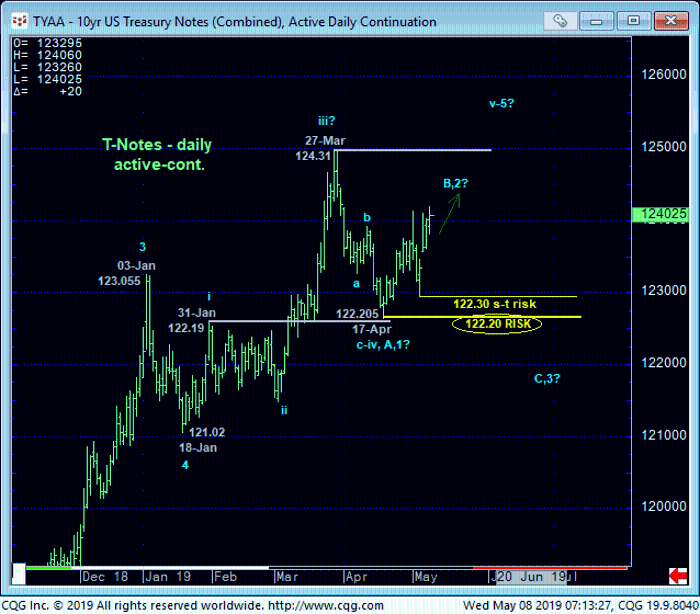
A key difference between T-notes and bunds is that from a very long-term perspective shown in the weekly chart below, the T-notes are nowhere near their Jul’16 high of 134-1/4. Such a vast difference precludes us from relying too heavily on a suspected positive correlation between these two markets.
In sum, traders are advised to return to a cautious bullish policy from 124.00 OB with an admittedly tight risk parameter at 123.19 to address the typically poor risk/reward merits of initiating directional exposure from the middle-half of a range.
