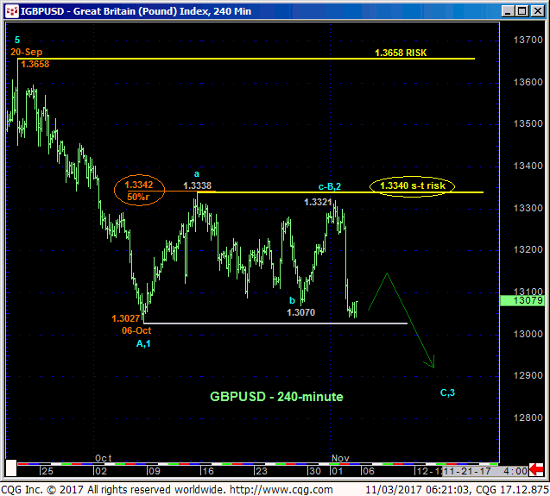
Yesterday’s sharp break below 27-Oct’s 1.3070 low renders Oct’s recovery attempt the 3-wave and thus corrective affair we suspected it was following early-Sep’s initial 50% rebuttal to late-Sep/early-Oct’s plunge from 1.3658 to 1.3027. Subsequent intra-1.3027-to-1.3338-range lateral chop detailed in the 240-min chart below coupled with yesterday’s sharp, impulsive break totally reinforces an interim bearish count that contends that Oct’s recovery from 1.3027 to Wed’s 1.3321 high is that of a corrective/consolidative structure that warns of a resumption of late-Sep/early-Oct’s downtrend to eventual and potentially steep losses below 1.3027.
As a direct result of yesterday’s relapse we are identifying 1.3340 as our new short-term risk parameter this market is now minimally required to recoup in order to threaten this bearish count. Since 06-Oct’s 1.3027 low and support has yet to be broken however, further intra-range chop could still lie ahead.

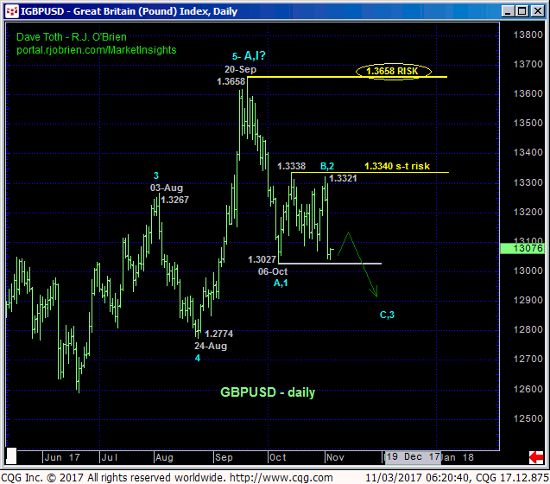
The corrective/consolidative nature of Oct’s price action following the late-Sep/early-Oct plunge from 1.3658 to 1.3027 is crystal clear in the daily chart above. Again, further consolidative chop within the 1.3027 – 1.3338-range could still lie ahead until that 1.3027 low and support is broken. But we strongly suspect that it’s only a matter of time before the late-Sep downtrend resumes as part of what we believe could be a 3-to-5-month correction lower in sterling within a major, multi-quarter BASE/reversal process.


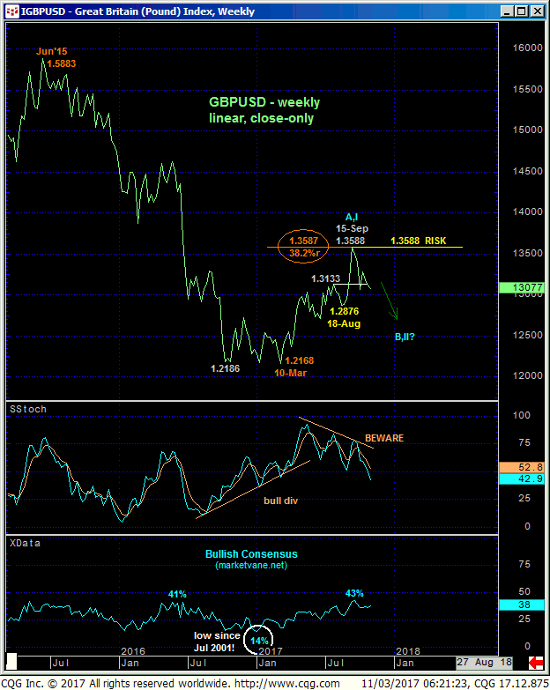
From a long-term perspective we remain of the opinion that this year’s rally is just the initial A- or 1st-Wave of a major, multi-quarter BASE/reversal count in sterling. This count was introduced in 20-Sep’s Technical Webcast and the market has yet to provide any evidence to refute it. Within this major base/reversal PROCESS however we believe the combination of:
- late-Sep’s bearish divergence in momentum from
- the exact (1.3587) 38.2% retrace of Jun’15 – Mar’17’s decline from 1.5883 to 1.2168 on a weekly close-only basis above
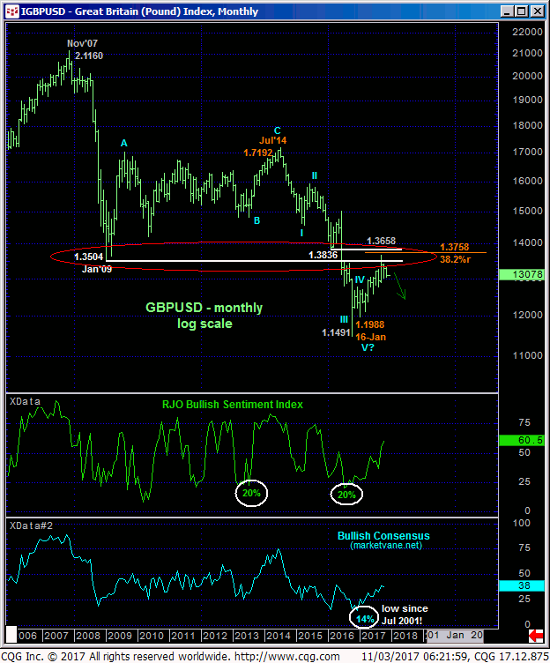
- AND the area of key former 1.35-to-1.38-area support-turned-resistance shown in the monthly log scale chart below (that includes the (1.3758) 50% retrace of the 2014-2017 portion of the bear from 1.7192 to 1.1988)
warns that 20-Sep’s 1.3658 high and key long-term risk parameter COMPLETED EITHER the initial A- or 1st-Wave of a major base/reversal environment OR a correction within the secular bear to eventual new lows below 1.1988. In either event we anticipate further lateral-to-lower prices- and potentially sharply lower prices- in the months ahead.
These issues considered, a bearish policy remains advised for longer-term players with strength above 1.3340 required to pare bearish exposure to more conservative levels and subsequent strength above 1.3658 to negate this count altogether and warrant its cover-and-reverse. For shorter-term traders the lower recesses of Oct’s 1.3027 – 1.3338-range is a poor risk/reward condition from which to re-establish a bearish policy, so they are advised to wait for either another intra-range rebound for a preferred risk/reward proposition and/or a break below 1.3025 to re-establish bearish exposure. Ultimately we believe another 2-to-4 months of lower prices to the lower-1.26-handle or below lies ahead with strength above 1.3340 required to defer this call and further strength above 1.3658 to negate it.


