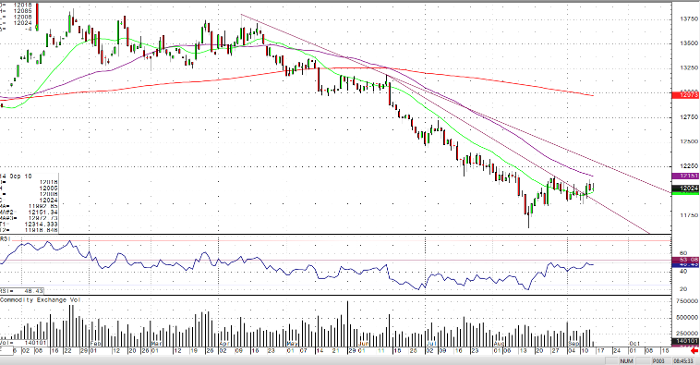
In the early morning trade, October gold is currently in the red slightly and trading at $1,202.1 and down $6 from the over night high. One of the reasons gold has come down form its yesterday and overnight highs is that the U.S. dollar tested its August lows. Yesterday, the weaker than expected CPI number put pressure on the Feds to tamper down their rate hikes in 2019 and possibly even in December; therefore, caused US dollars to selloff and gave support to gold. However, gold could not hold its August 28th high of $1,215.7, so unless it gets above that level today you could see some profit taking from the bulls.
If you look at the daily October gold chart, you’ll see that it’s trying to put in a firm bottom and has even broke above a short-term bearish trendline. However, it has yet to get above and hold the August 28th high, as stated above, and it still below its 50-day moving average. Gold is still in bearish trend, but if it breaks above the August 28th high, you can then see a rally up to about $1,230.0 an ounce before any major resistance.
Gold Oct ’18 Daily Chart


