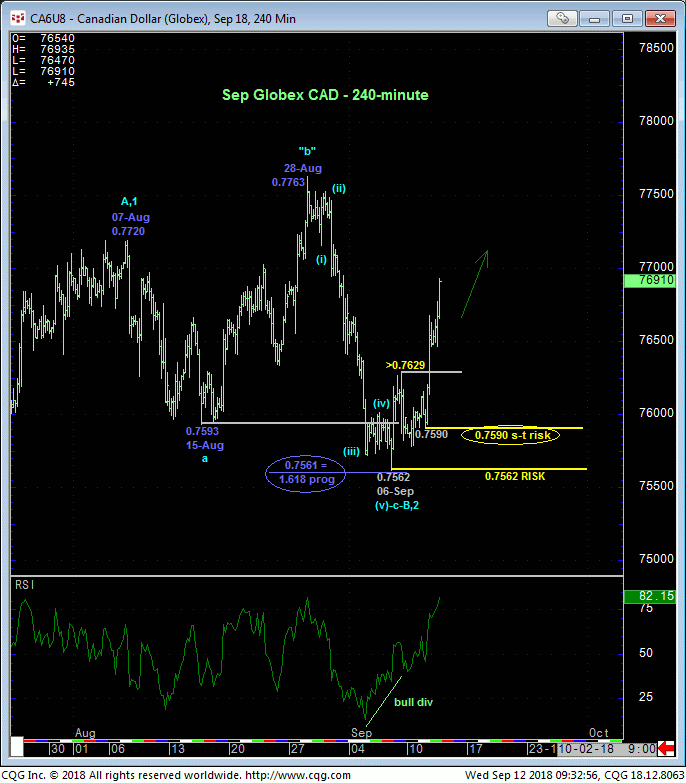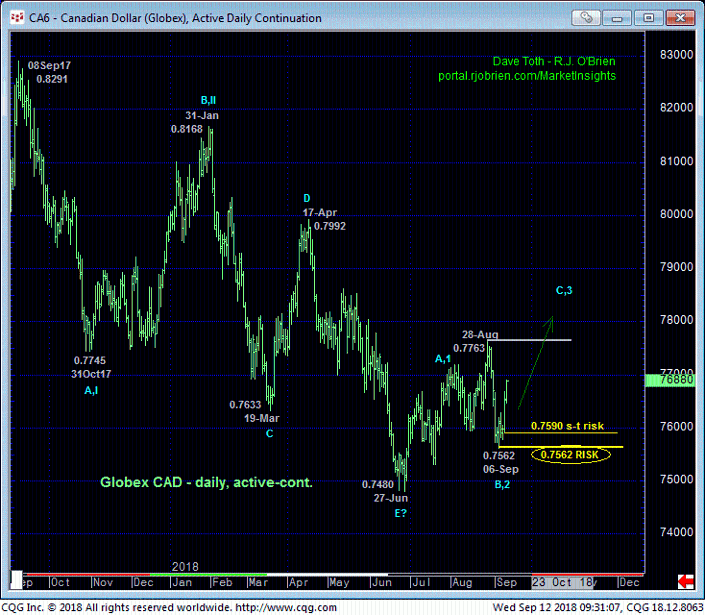
The market’s gross failure to sustain early-Sep losses below 15-Aug’s 0.7593 low and Fibonacci fact that the decline from 28-Aug’s 0.7763 high spanned a length exactly 61.8% longer than early-to-mid-Aug’s preceding sell-off attempt from 0.7720 to 0.7593 warns that 06-Sep’s 0.7562 low completed an “irregular” correction that began from 07-Aug’s 0.7720 high as labeled in the 240-min chart below. If correct, this count warns of a sharp, accelerating (C- or 3rd-Wave) resumption of Jun-Aug’s uptrend to new and potentially significant heights above 0.7763.
As a direct result of yesterday and today’s rally the market has identified 0.7590 and 0.7562 as smaller- and larger-degree corrective lows from which traders can objectively base and manage the risk of a resumed bullish policy. These levels represent our new short- and longer-term risk parameters.


As recently discussed over the past few months, he 2-steps-down-1-step-up manner in which the decline from Sep’17’s 0.8291 high unfolded has been a falling-wedge nightmare. And it looks like the base/reversal/recovery from 27-Jun’s 0.7480 low is unfolding the same way. Whatever….the past couple days’ rebound is certainly enough against the backdrop of an arguably still-developing 2-1/2-month uptrend to define yesterday’s 0.7590 low and last week’s 0.7562 low as ones of developing importance and specific risk parameters from which a resumed bullish policy and exposure can be objectively based and managed.
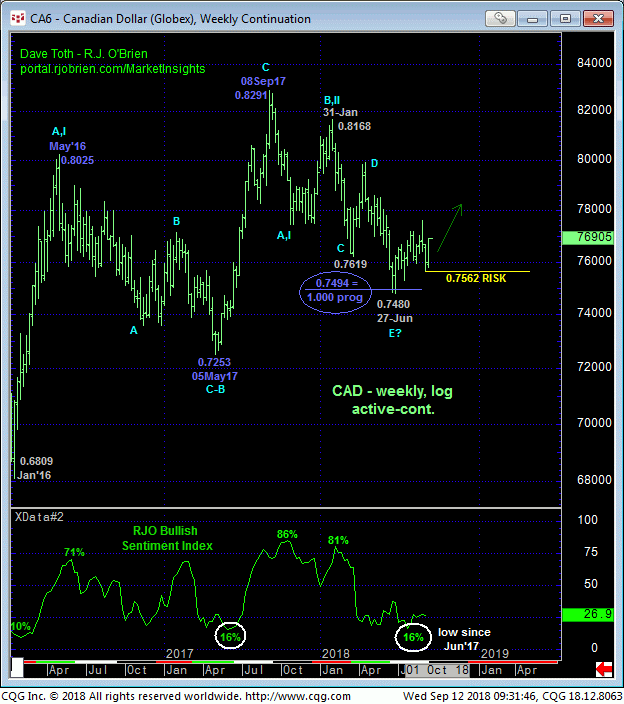
Historically bearish sentiment shown in the weekly log chart below would seem to reinforce this bullish count that would call for potentially extensive gains above Aug’s 0.7763 high in the weeks and even months ahead, including a run at last year’s 0.8291 high. The Fibonacci fact that Sep’17 – Jun’18’s decline from 0.8291 to 0.7480 was virtually identical (i.e. 1.000 progression) to 2016-17’s preceding 0.8025 – 0.7253 decline also contributes to this major base/reversal-threat environment.
These issues considered, traders are advised to return to a bullish policy and first approach setback attempts to 0.7650 OB as corrective buying opportunities with a failure below 0.7590 threatening this call enough to warrant its cover. In lieu of at least such sub-0.7590 weakness, we anticipate further and possibly accelerated gains in the weeks and even months ahead.


