JUN EURO
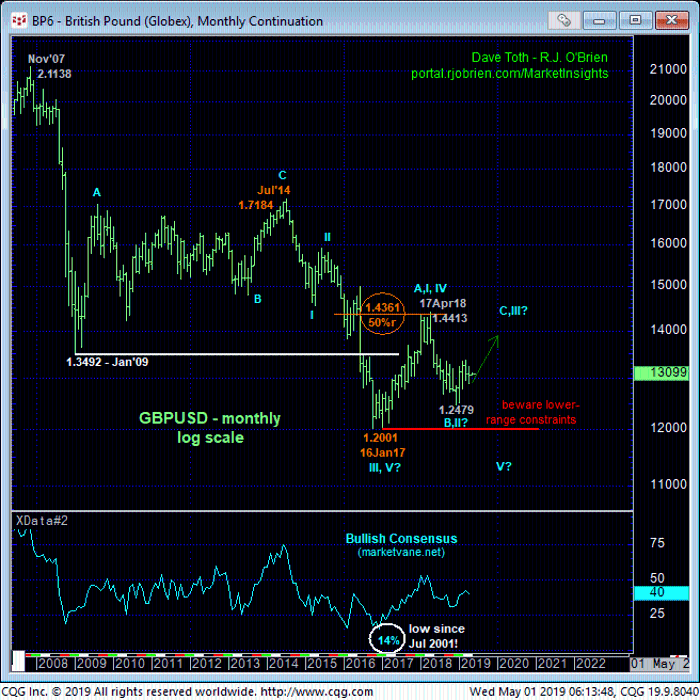
The market’s inability to sustain sub-1.1280 losses in general and below 23-Apr’s 1.1281 minor corrective high and our short-term risk parameter specifically has broken the latest portion of the downtrend from 12-Apr’s 1.1386 high. The resulting bullish divergence in short-term momentum defines 26-Apr’s 1.1156 low as one of developing importance and our new short-term risk parameter from which non-bearish decisions like short-covers and cautious bullish punts can now be objectively based and managed.
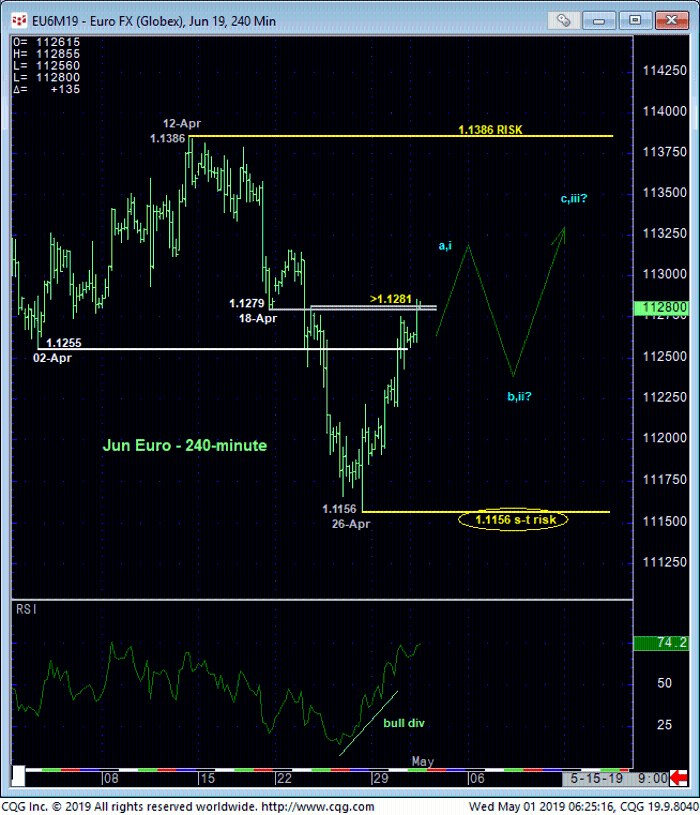 The daily chart below shows the market’s failure thus far to sustain last week’s losses below a goodly amount of former support from the mid-1.12-handle-area that then “should have” held as new resistance if the market was still truly weak “down here”. This said, commensurately larger-degree strength above 12-Apr’s 1.1386 next larger-degree corrective high remains absolutely required to confirm a bullish divergence in momentum of a SCALE SUFFICIENT to break the major downtrend. In effect then, the market has identified 1.1386 and 1.1156 as the key directional triggers heading forward.
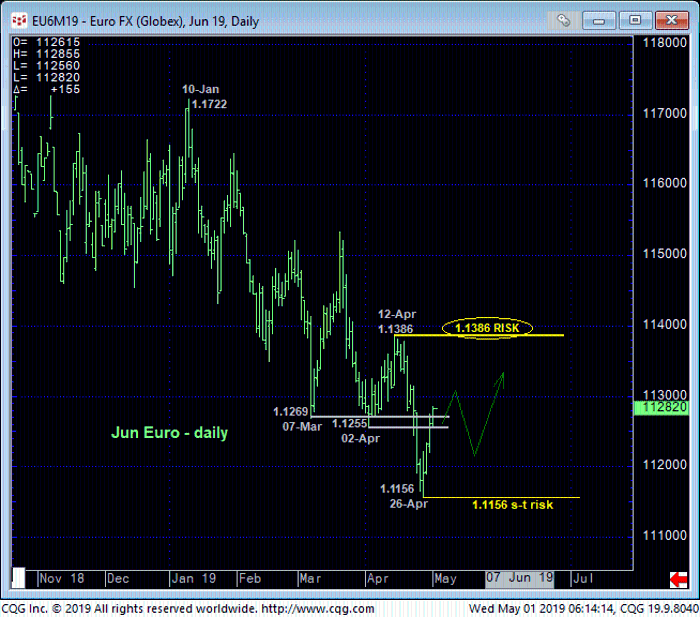
The VERY interesting thing about today’s bullish divergence in admittedly short-term momentum is that it:
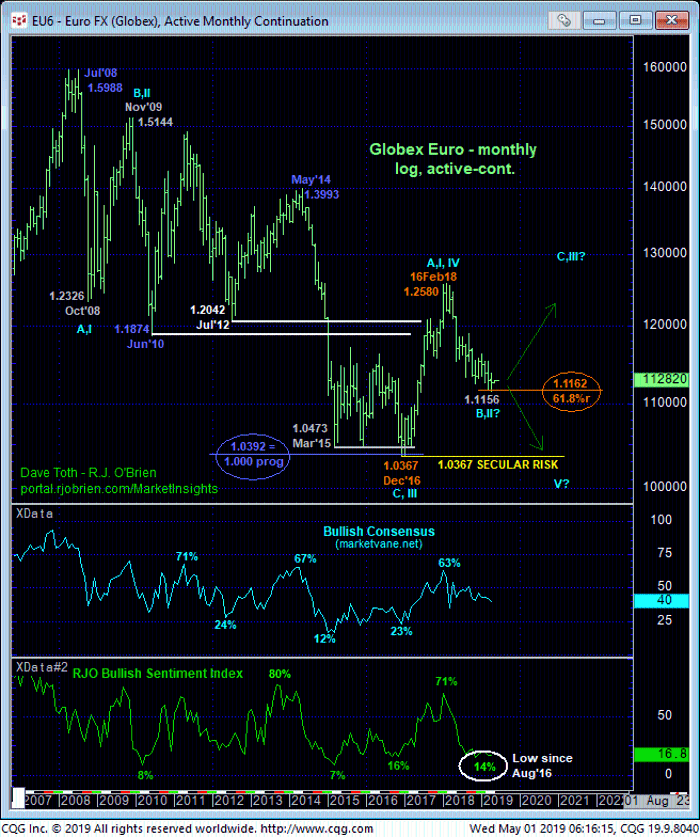
- stems from a 1.1156 level that is only six pips from the (1.1162) 61.8% retrace of Dec’16 – Feb’18’s entire 1.0367 – 1.2580 rally amidst
- historically bearish levels in our RJO Bullish Sentiment Index of the hot Managed Money positions reportable to the CFTC not seen in 2-1/2 years and
- downside momentum that’s been waning since last Aug.
It may also prove notable that as of last week’s low, the downtrend from 16Feb18’s 1.2580 high has spanned 62 weeks. This is only one week longer than Dec’16 – Feb’18’s preceding 1.0367 – 1.2580 rally that spanned 61 weeks, so there’s a 1.000 progression element in terms of time.
These technical facts that typically characterize major base/reversal environments are shown in the weekly log scale chart below and warn us not to ignore the possibility that Fri’s 1.1156 low could have completed a major 14-month correction ahead of a resumption of 2017’s uptrend to eventual new highs above 1.26! Now we’ve discussed a zillion times that one cannot conclude a major reversal from proof of just minor strength. And to be sure, strength above 12-Apr’s 1.1386 next larger-degree corrective high remains MINIALLY required to take that next reinforcing base/reversal step. But what we are saying is that the technical facts cited above identify a condition and opportunity that is particularly compelling and unique and should be approached as such until and unless negated by a relapse below 1.1156.
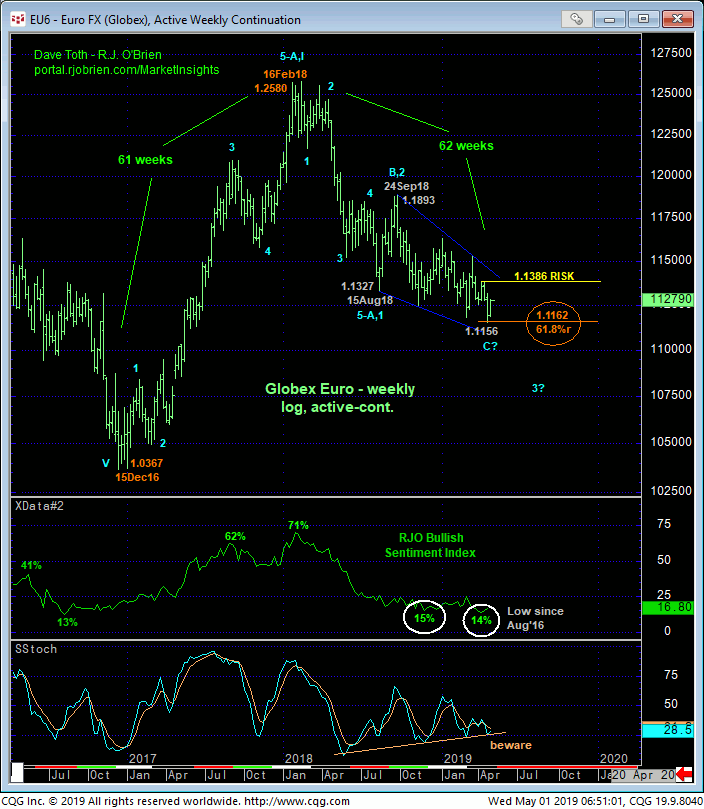
Finally, from a historic monthly log basis below, long-term players are reminded that the extent and impulsiveness of 2017’s rally arguably broke the secular bear trend and cannot be ignored as just the INITIAL (A- r 1st-Wave) of a huge, multi-year BASE/correction/reversal process. Against this backdrop the relapse from Feb’18’s 1.2580 high would be the (B- or 2nd-Wave) corrective subset within this process. IF this long-term bullish count is correct, it would be from pretty much exactly these waning downside momentum, historically bearish sentiment and 61.8% retrace conditions that we’d expect the correction to hold and ultimately yield to (2017’s) new bull trend that preceded it. If this count is wrong or just a little early, all the bear’s gotta do is relapse below our 1.1156 short-term risk parameter. Until and unless it does, and especially if the market can next prove commensurately larger-degree strength above 1.1386, the bullish ramifications thereafter could be astounding.
These issues considered, short-term traders have been advised to move to a neutral/sideline position while longer-term players have been advised to pare bearish exposure to more conservative levels and jettison the position altogether on commensurately larger-degree strength above 1.1386. Shy of reaffirming strength above 1.1386, we will next look for proof of labored, 3-wave behavior on subsequent relapse attempts as reinforcing evidence of a base/reversal environment that could evolve into a shocker in the months and quarters ahead.
JUN BRITISH PUND
Given the EURGBP cross’ multi-year lateral range, sterling isn’t going anywhere that the euro isn’t, so virtually all of what we’ve detailed above in our euro analysis also applies to sterling. And the past couple days’ rebound confirms a bullish divergence in short-term momentum that identifies Thur’s 1.2899 low as one of developing importance and our new micro risk parameter from which any non-bearish decisions like short-covers and cautious bullish punts can now be objectively based and managed.
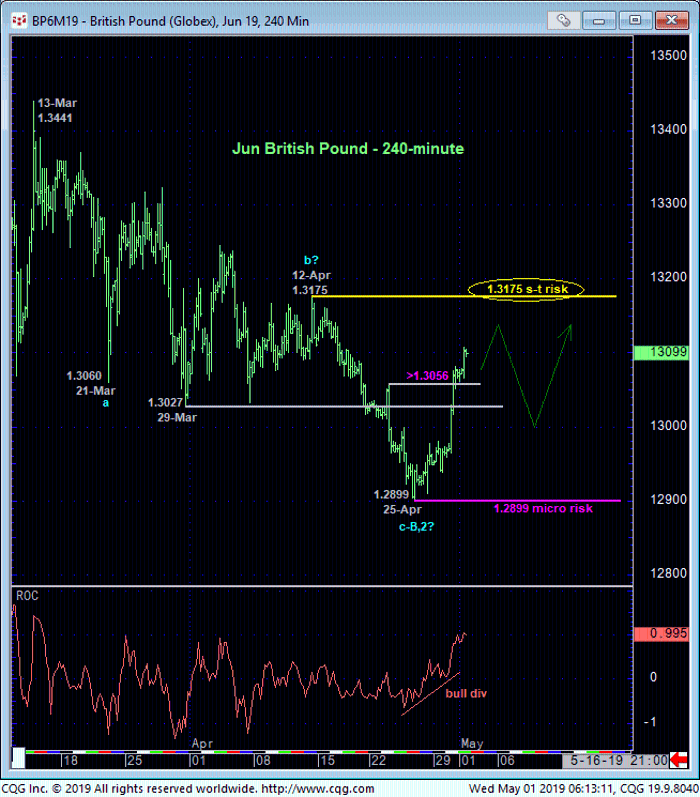
Larger-degree strength above 12-Apr’s 1.3175 corrective high and our short-term risk parameter remains required to break Mar/Apr’s slide and render it a 3-wave and thus corrective affair that we believe would then re-expose Dec-Mar’s uptrend that preceded it. But the market’s failure thus far t sustain last week’s losses below prior 1.3025-area support-turned-resistance is a reinforcing step in this eventual 1.3175+ direction.
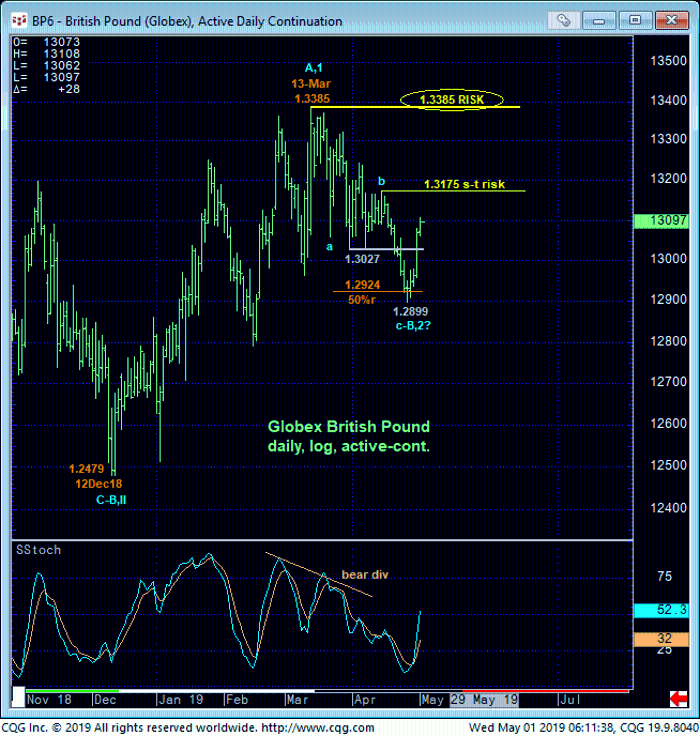
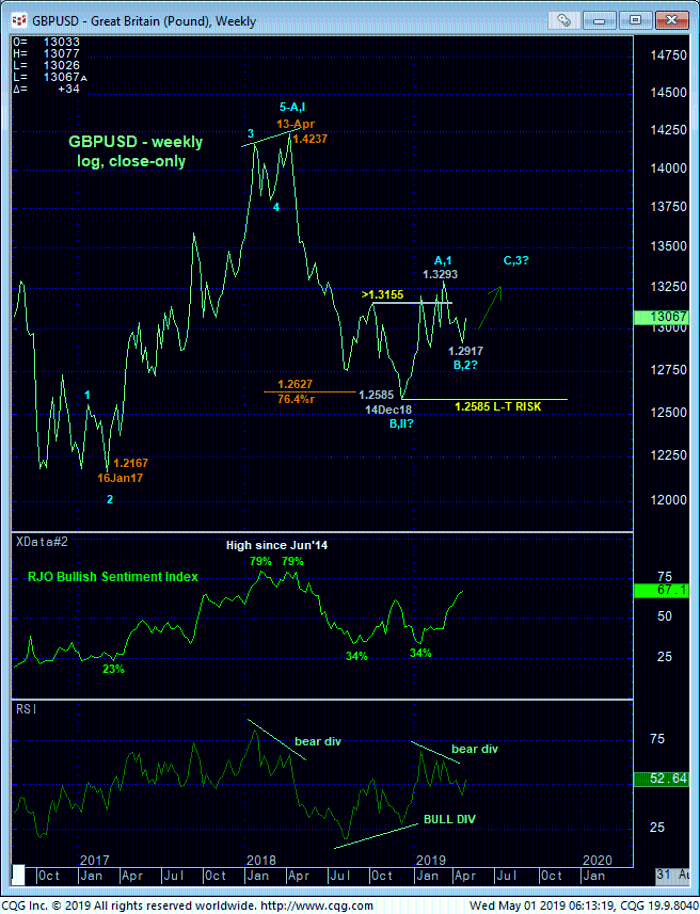
From a very long-term perspective shown in the weekly log close-only chart of the cash sterling above and monthly log chart below, the market’s rejection of the lower recesses of the past couple years’ range and bullish divergence in weekly momentum identifies the mid-Dec low as obviously one of developing importance and a key long-term risk parameter the market needs to break to mitigate a major, multi-year BASE/correction/reversal-threat environment that, if correct, warns of a resumption of 2017’s raly to eventual 1.45+ levels.
These issues considered, shorter-term traders are advised to move to a neutral/sideline position as a result of today’s gains. We will next look for proof of labored, corrective behavior on subsequent relapse attempts for favorable risk/reward buying opportunities. Long-term players are advised to pare bearish exposure to more conservative levels and jettison the exposure altogether on a recovery above 1.3175.
