JUN CATTLE
In our last 09-May Technical Blog following that day’s break below all of Apr’s lower-132-handle-area support, we discussed the reaffirmation of our major peak/reversal count from 10-Feb’s 143.35 high. Over the past two weeks however, only a glance at the hourly chart below is needed to see that this prospective bearish stampede has slowed to a mere mosey. This falling-wedge-type price action is UNcharacteristic of a broader 3rd-Wave down of a continued major reversal and may be an indication that the alternative C-Wave decline from 22-Ar’s 140.00 high might be nearing its end.
The developing potential for a bullish divergence in momentum is clear, with a recovery above 17-May’s 133.925 minor corrective high needed to CONFIRM the divergence to the point of non-bearish decisions like short-covers and cautious bullish punts. Given the magnitude of the decline from 22-Apr’s 140.00 high however, it would be premature to conclude a broader base and reversal from proof of just short-term strength above 133.925. Indeed, there are a number of corrective highs the market would then have to recoup to reinforce a broader base/recovery count. Nonetheless, a recovery above 133.925 would provide an early indication of strength that would start to chip away at the risk/reward merits of maintaining a bearish policy and exposure “down here”.
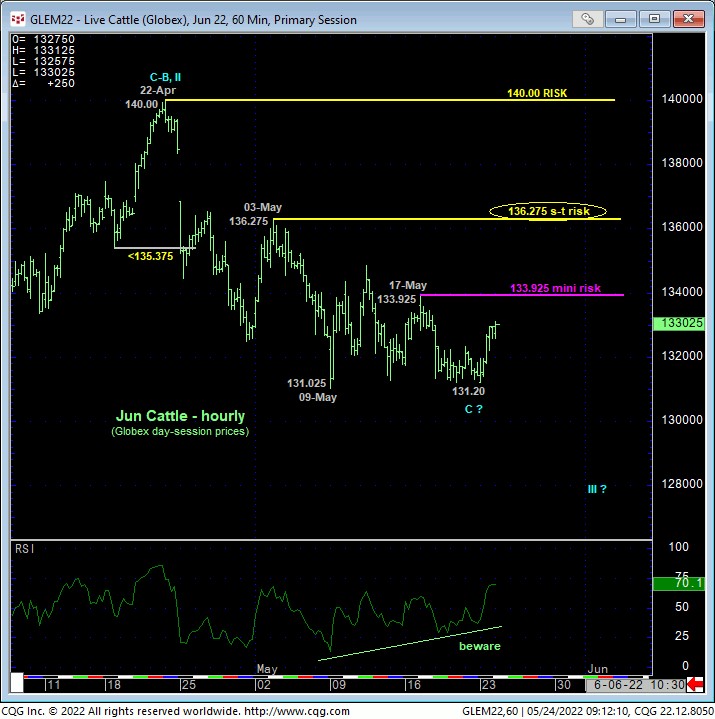
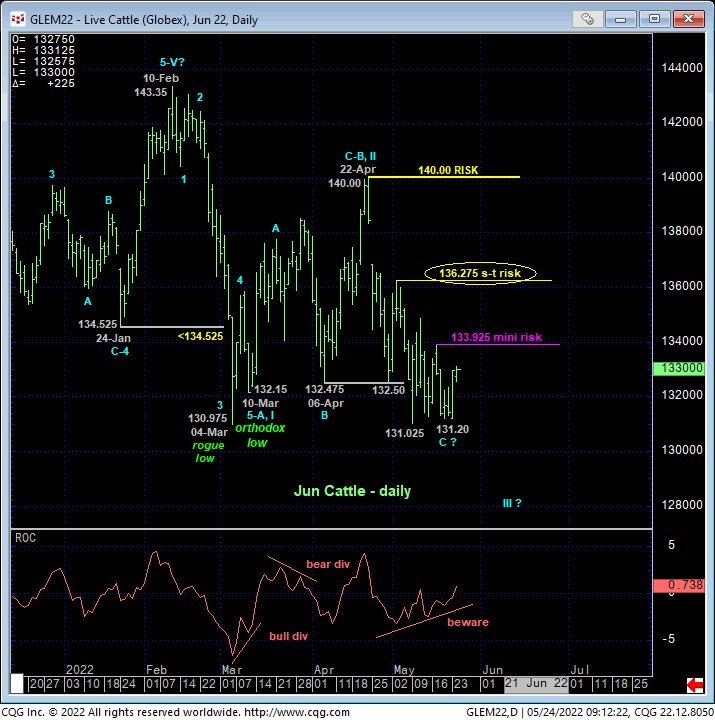
Stepping back, the daily chart above shows the nicely developing potential for a bullish divergence in DAILY momentum, but it’d hard to conclude the end of the broader downtrend from 22-Apr’s 140.00 high from proof of just short-term strength above 133.925. As you climb up the ladder of corrective highs however to, say, 03-May’s 136.275 high that’s back in the middle of the past 2-1/2-months’ range, directional decisions like short-covers and/or bullish punts become less optimal and raise the odds of aimless whipsaw risk. Per such and under these conditions, traders are advised to be as tight or as loose with risk assumption as is objectively commensurate with their personal risk profile.
For instance, to CONFIRM this year’s entire sell-off from 10-Feb’s 143.35 high as a 3-wave and thus corrective structure that would then re-expose the secular bull trend, the market would clearly have to recover above 22-Ar’s 140.00 high. Such a long-term risk parameter would be pertinent to long-term commercial players. But under current circumstances, this is hardly a “practical” bear risk parameter, even for long-term players. Per such, we would advise longer-term players to pare or neutralize bearish exposure on proof of admittedly minor strength above a level likem133.925 and acknowledge and accept whipsaw risk, back below the recent 131.20 low, in exchange for much steeper nominal risk above either 03-May’s 136.275 corrective high and/or 140.00. For shorter-term traders with tighter risk profiles, 17-May’s 133.925 corrective high serves as an excellent and objective mini risk parameter.
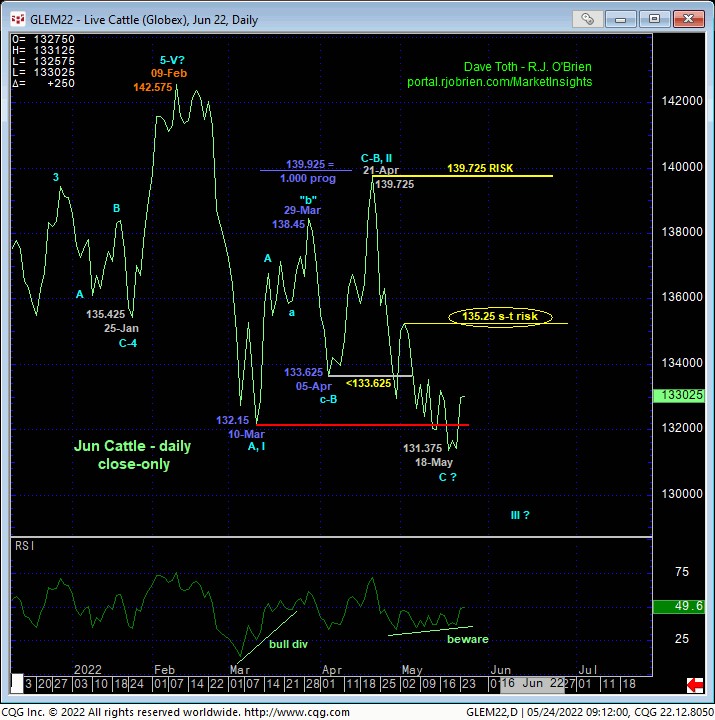
On a daily close-only basis, the chart below shows the past week-and-a-half’s closes below 10-Mar’s key 132.15 low close. But the languishing price action and failure to produce further collapsing prices are disappointing and question the risk/reward merits of a continued bearish policy “down here”.
These issues considered, a bearish policy and exposure remain advised with a recovery above 133.925 required to defer or threaten this call enough for both short- and longer-term players to move to at least a neutral/sideline position or even a cautiously bullish policy.
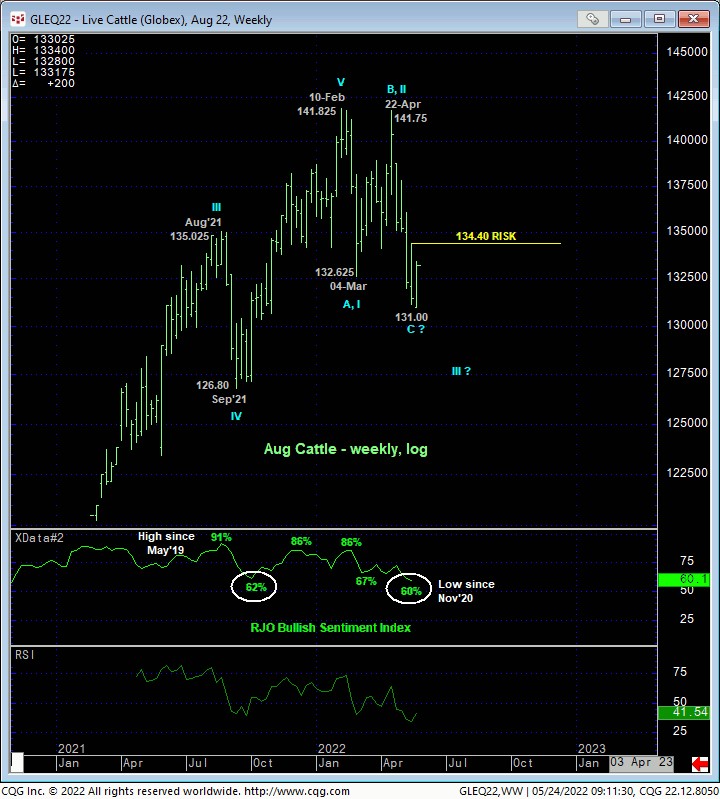
AUG CATTLE
On the teeniest of scales, yesterday’s recovery above a very, very minor corrective high from Fri at 132.725 confirms a bullish divergence in very short-term momentum. This mini mo failure defines yesterday’s 131.00 low as one of developing importance and a mini risk parameter from which non-bearish decisions like short-covers and cautious bullish punts can be objectively based and managed. Needless to say however given the magnitude of Apr-May’s collapse, commensurately larger-degree strength above 17-May’s 134.40 next larger-degree corrective high remains required to confirm a bullish divergence in daily momentum and of a scale sufficient to more objectively speculate that the downtrend from 22-Ar’s 141.75 high may have ended.
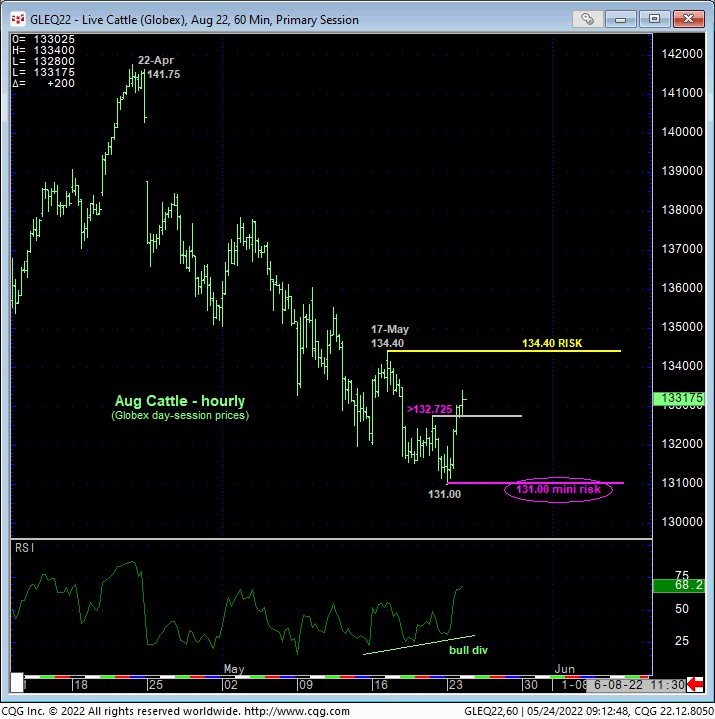

The daily chart above shows the developing POTENTIAL for a bullish divergence in momentum that will be considered CONFIRMED to the point of non-bearish action on a recovery above 134.40. However, this chart also shows yesterday’s “outside day up” (higher high, lower low and higher close than Fri’s range and close) that, in and of itself, is a minor reversal-threat element but often times is a sub-component of a broader base/reversal process. Additionally, the weekly log scale chart of the now-prompt Aug contract below shows the decline in our RJO Bullish Sentiment Index to its lowest (605) level since Nov’20 resulting from the capitulation of Managed Money long positions reportable to the CFTC. Such relatively low levels would not be inconsistent with a larger-degree corrective recovery or broader reversal higher.
These issues considered, shorter-term traders with tighter risk profiles are advised to move to a neutral-to-cautiously-bullish stance with a failure below 131.00 negating this call, warranting its cover and reinstating the broader bear. A bearish policy and exposure remain advised for longer-term commercial players with a recovery above 134.40 deferring or threatening this call enough to warrant moving to a neutral/sideline position in order the circumvent the heights unknown of a broader correction or reversal higher. In effect, we believe the Aug contract has identified 134.40 and 131.00 levels as the key flexion points around which traders can objectively toggle directional biases and exposure commensurate with their personal risk profiles.