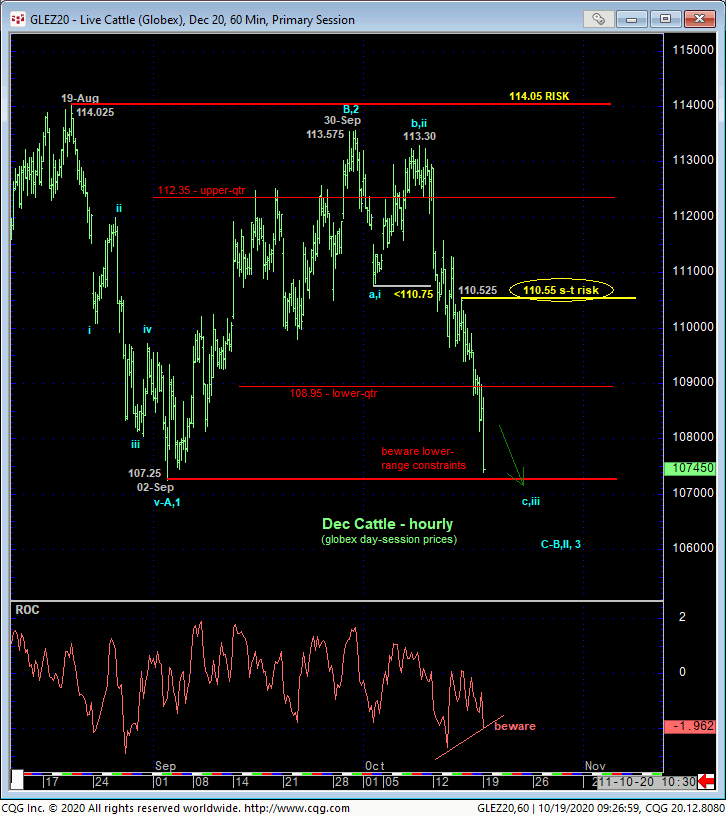
The remainder of last week’s slide reaffirms our continued correction/consolidative count discussed in 13-Oct’s Technical Blog following that day’s bearish divergence in momentum below 02-Oct’s 110.75 low. This resumed weakness leaves an intra-day high from last Wed at 110.525 as the latest smaller-degree corrective high we believe this market is now required to sustain losses below to maintain a more immediate bearish count. Its failure to do so would confirm a bullish divergence in momentum, certainly stem this latest intra-range slide and reinforce a more lateral and shallow consolidation consistent with this year’s broader reversal. Until and unless such 110.55+ strength is shown, further and possibly accelerated losses should not surprise, including a bust-out below the 107.25 low boundary of the consolidation defined by 02-Sep’s low.
This tight but objective risk parameter at 110.55 may come in handy given the market’s proximity to the extreme lower recesses of the range that has constrained prices since mid-Aug where the shoe may be on the other hoof from its position at the upper extremes of the range two weeks ago that warned of and contributed to the intra-range peak/reversal count.
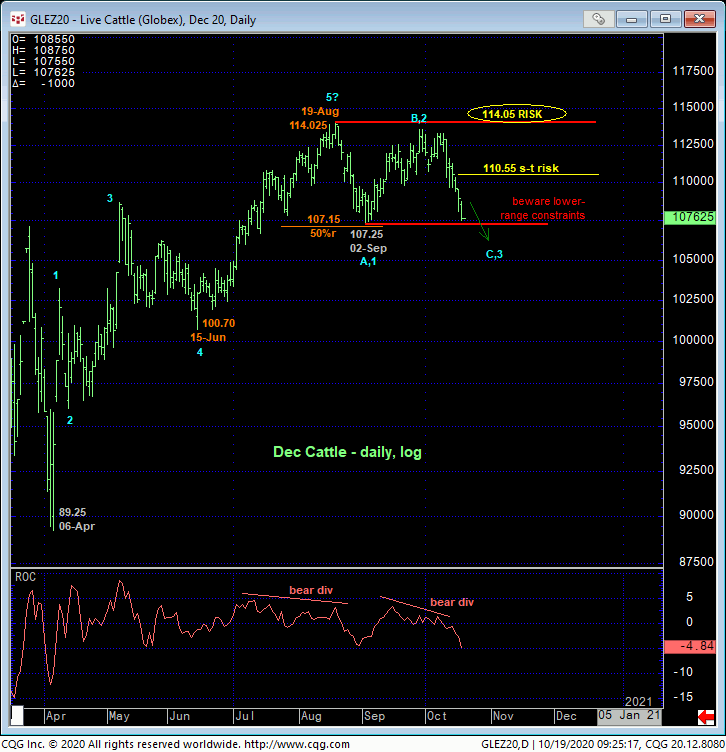
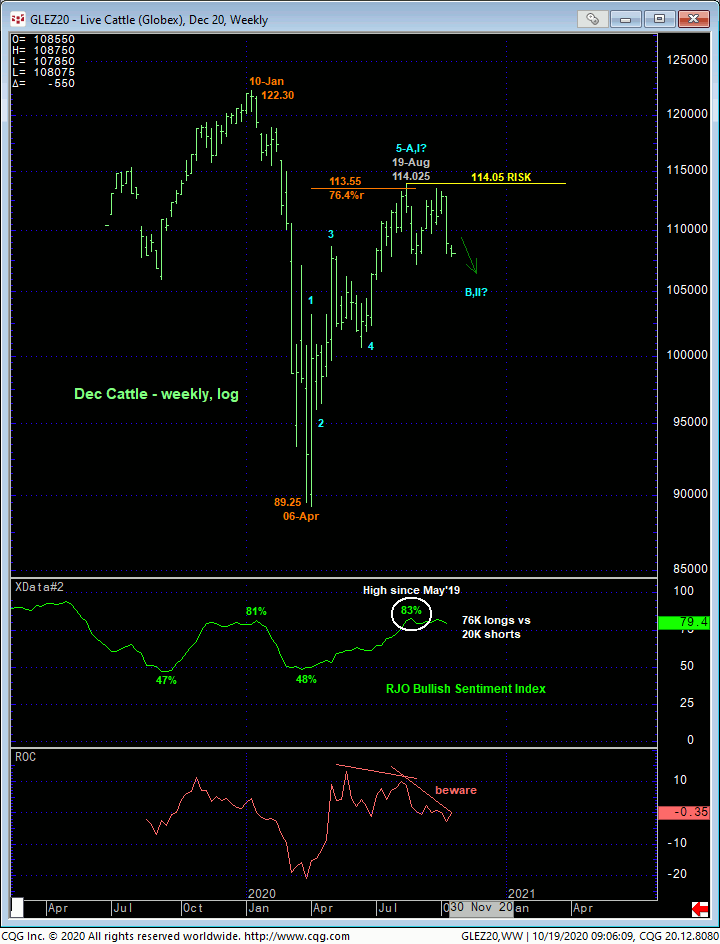
The daily (above) and weekly (below) log scale charts show the past couple week’s reaffirmation of our broader peak/correction/reversal count introduced in 27-Aug’s Technical Blog following 26-Aug’s bearish divergence in short-term momentum. On this broader scale, 19-Aug’s 114.025 high remains as THE KEY risk parameter this market needs to recoup to confirm the correction’s end and this year’s major bull’s resumption. Until this market recoups at least 110.55 however, and especially 114.05, further lateral-to-lower consolidation/correction is expected, with a break below 02-Sep’s 107.15 low exposing an indeterminable amount of nasty below it as there are NO levels of any technical merit below that point. And indeed, at a still-frothy 79% level in our RJO Bullish Sentiment Index reflecting 76K Managed Money longs vs 20K shorts, there’s plenty of fuel for downside vulnerability if/when the market breaks 107.25.
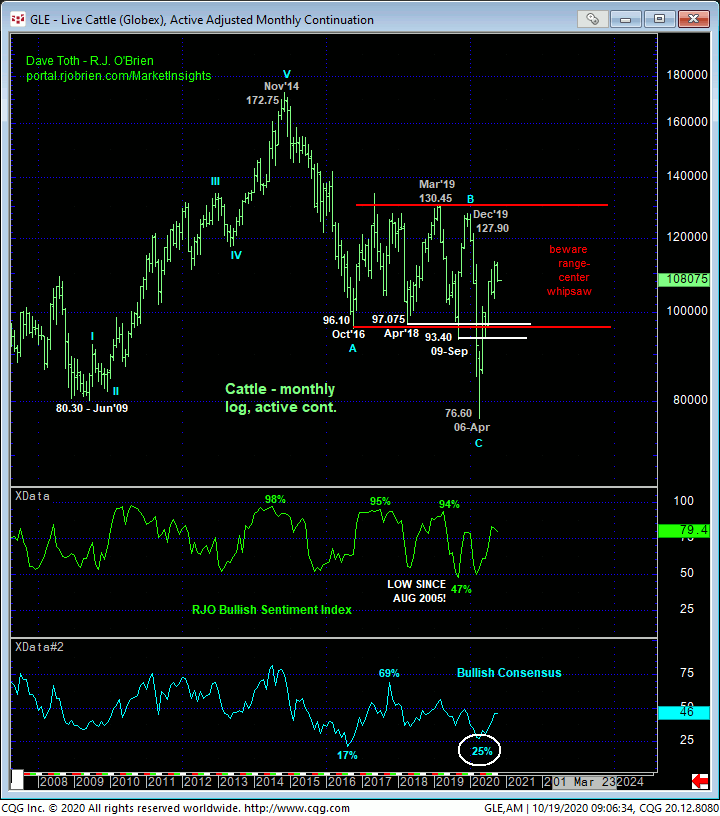
Finally, on an even broader scale, the monthly log chart below shows the market’s position deep within the middle-half bowels of the 95-to-130-range where this market found fair value for 3-1/2 YEARS before Mar/Apr’s COVID-related spasm. Traders are urged to acknowledge the greater odds of aimless whipsaw risk typical of such range-center environs. This could mean a major whipsaw below 107.25 before the market bouncing right back. But again, if/when the market breaks 107.25, there is no objective way to know how low “low” is. The ONLY levels of any technical pertinence at that point will exist ABOVE the market in the forms of former support-turned-resistance (like the lower-107-handle) an prior corrective highs like 110.55 and 114.05. There will be NO objective reason to maintain any bullish exposure on a sub-107.25 break. “Better bein’ out, wishin’ you were in, than in, wishin’ you were out.“
These issues consid4ered, a bearish policy remains advised with a recovery above at least 110.55 required to negate this specific call and warrant its cover. In lieu of such strength, further and possibly protracted losses should not surprise.