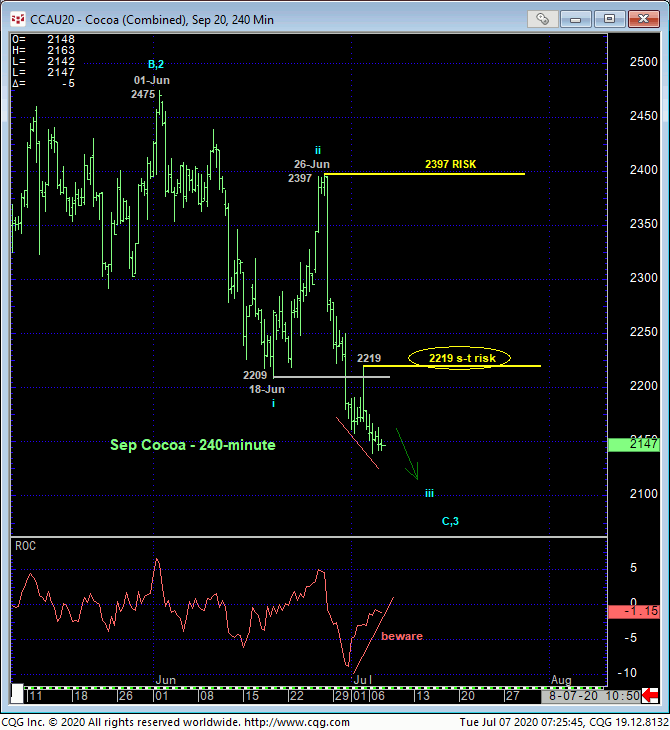
Yesterday’s resumption of the past month’s downtrend is important not only because it reaffirms at least an interim bearish count, but also because it defines Thur’s 2219 high as the latest smaller-degree corrective high the market is now minimally required to recover above to confirm a bullish divergence in short-term momentum, arrest the slide and expose an interim corrective hiccup. The 240-in chart below also shows the market acknowledging former support around the 2209-area from mid-Jun as new near-term resistance. Per such, this 2219 level serves as our new short-term risk parameter from which shorter-term traders can objectively rebase and manage the risk of a cautious bearish policy and exposure.


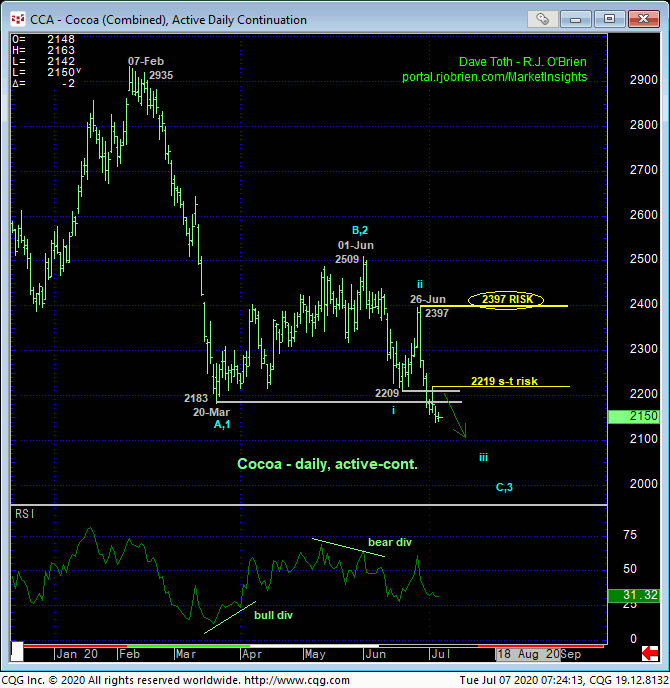
The daily chart above shows the market thus far sustaining losses below the 2209-to-2183-area that supported the market for THREE MONTHS until 30-Jun’s breakdown below it. IF the market is truly weak “down here”, it should not only easily sustain sub-2183 losses, but produce clear, trendy, impulsive, even accelerated losses straight away.
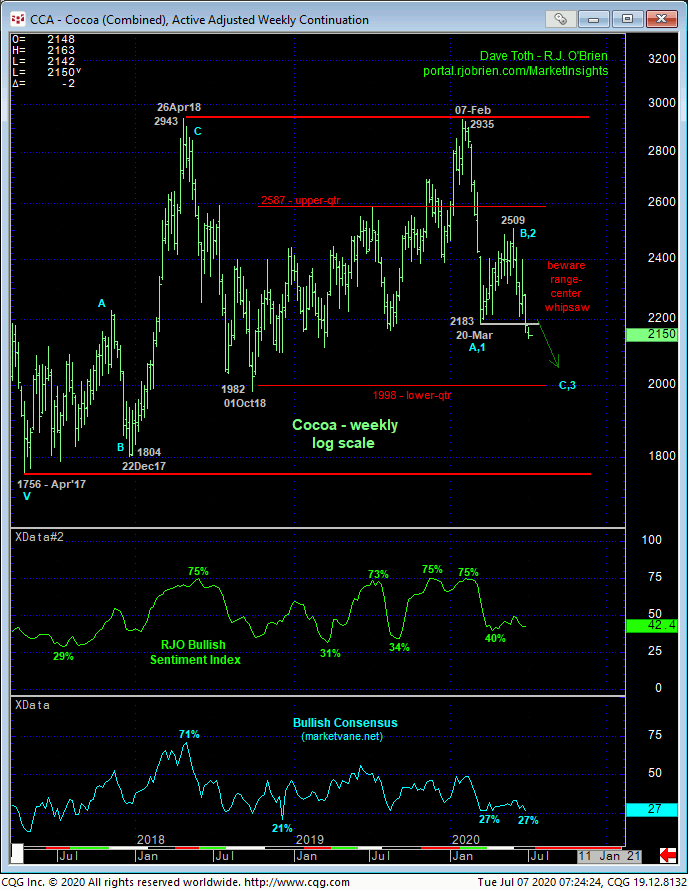
Indeed, looking at the weekly log chart below, there are NO levels of any technical merit between spot and Oct’18’s 1982 low and the lower-quarter of this market’s historical lateral range. The Elliott Wave prospect that the decline from 01-Jun’s 2509 high is either a major C- or 3rd-Wave down as the resumption of Feb-Mar’s major, if intra-range downtrend would be expected to produce steep, obvious losses straight away.
HOWEVER….the weekly chart below and monthly chart (bottom) also show this market still deep within the middle-half bowels of its historical lateral range where we never want to ignore the greater odds of aimless whipsaw risk. Herein lies the importance of even a smaller-degree risk parameter like 2219. The market’s failure to sustain losses below 2219 would be the first bit of evidence to threaten a broader bearish county. It is acknowledged however that commensurately larger-degree strength above 26-Jun’s 2397 larger-degree corrective high remains required to, in fact, break Jun-Jul’s bigger downtrend and negate a longer-term bearish count to the point of total non-bearish action by long-term players. We cannot conclude a larger-degree recovery from merely smaller-degree strength above a level like 2219.
Another factor to keep in mind IF the market doesn’t sustain trendy, impulsive behavior down is the fact that market sentiment indicators remain at historically low, pessimistic levels. These levels do not matter as long as the market sustains the clear and present downtrend. But the moment the market fails in this requirement is the moment that sentiment/contrary opinion contributes to a BASE/reversal threat. Here again lies the importance of an admittedly shorter-term risk parameter like 2219.

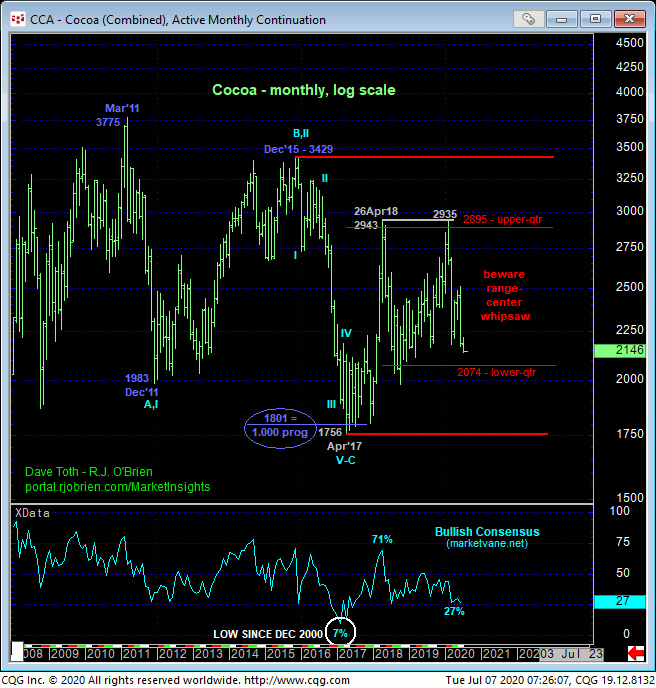
Finally, the monthly log chart below shows the market’s position still deep within the middle-half bowels of its historical 12-YEAR lateral range where aimless, whipsaw price action has dominated the past two years. This is not to say that there aren’t some opportunistic moves within this chop. But traders need to be aware of this longer-term condition that we believe warrants a more conservative approach to risk assumption as the odds of hitting a directional home run are low relative to the risk one has to assume to swing for the longer-term fences.
These issues considered, a cautious bearish policy remains advised with a recovery above 2219 minimally required for shorter-term traders to move to the sidelines and for longer-term players to pare exposure to more conservative levels. In lieu of such strength, further and possibly accelerated losses straight away should not surprise.


