There hasn’t been much to write about lately on cocoa because this market has been wafting laterally in a 3-month range that’s still deep within the middle-half bowels of a 2-YEAR lateral range. Flip a coin. The risk/reward merits of initiating directional exposure from this condition have been poor and remain so.
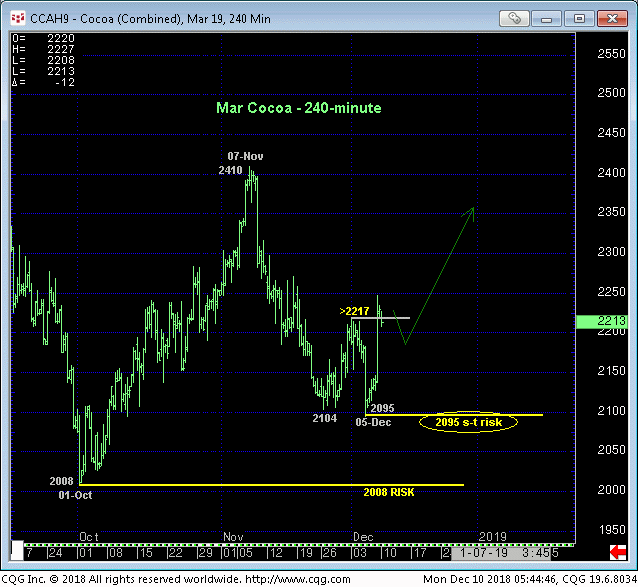
However, with Fri’s recovery above 03-Dec’s 2217 corrective high detailed in the 240-min chart above, the market confirms a bullish divergence in momentum shown in the daily chart below. The important by-product of this range-center bullish divergence in mo is the market’s definition of 05-Dec’s 2095 low as one of developing importance and a tighter but yet reliable low from which cautious bullish bets can be objectively based and managed. And while the current “ranges-within-ranges” predicament warns against any directional bets, it is interesting to note basing behavior that dates from early-Aug’s 2035 low.
Indeed, until and unless this market relapses below at least 2095, the past four months’ price action is arguably a textbook example of both a “rounding-bottom” reversal patter and a head-&-shoulders reversal pattern. Neither of these patterns will be CONFIRMED to the point of longer-term bullish action until the market breaks the obviously pivotal 2397 level that has capped this market as resistance for 3-1/2-months, so we don’t want to over-expect or be to aggressive from the current bowels of the incessant range(s). But until the market fails below 2095, we believe the risk/reward merits are favorable for a cautious bullish stance that could provide huge dividends in the months ahead.
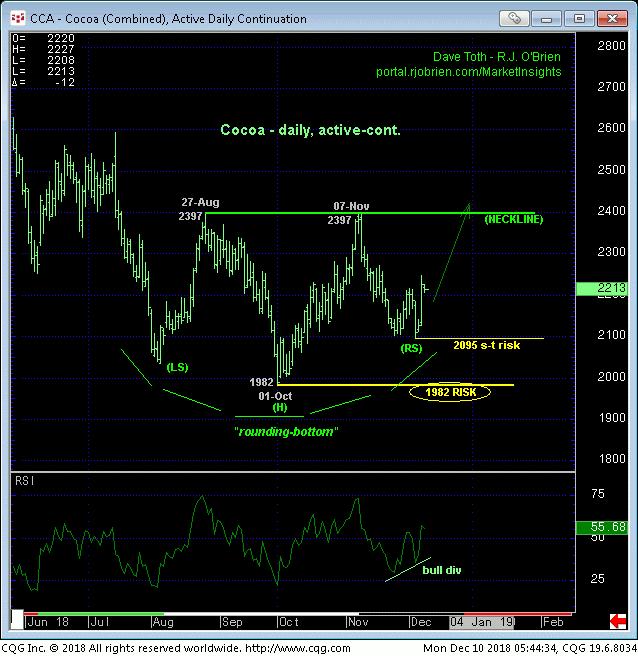
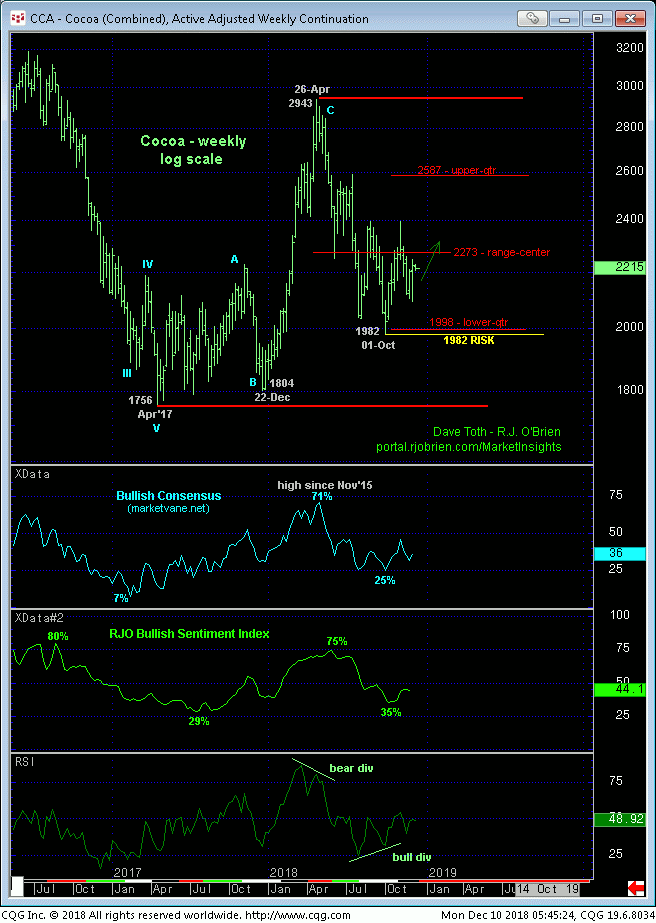
The weekly log active-continuation chart below shows the market still wafting around the middle of the past couple years’ range in what was fully expected to provide aimless, whipsaw behavior. In this regard the market hasn’t disappointed. Further aimless chop should hardly surprise. But, as a result of Fri’s bullish divergence in short-term mo, neither should a run to the upper recesses of the past few months’ range or, who knows, perhaps a breakout above that pivotal 2397-area.
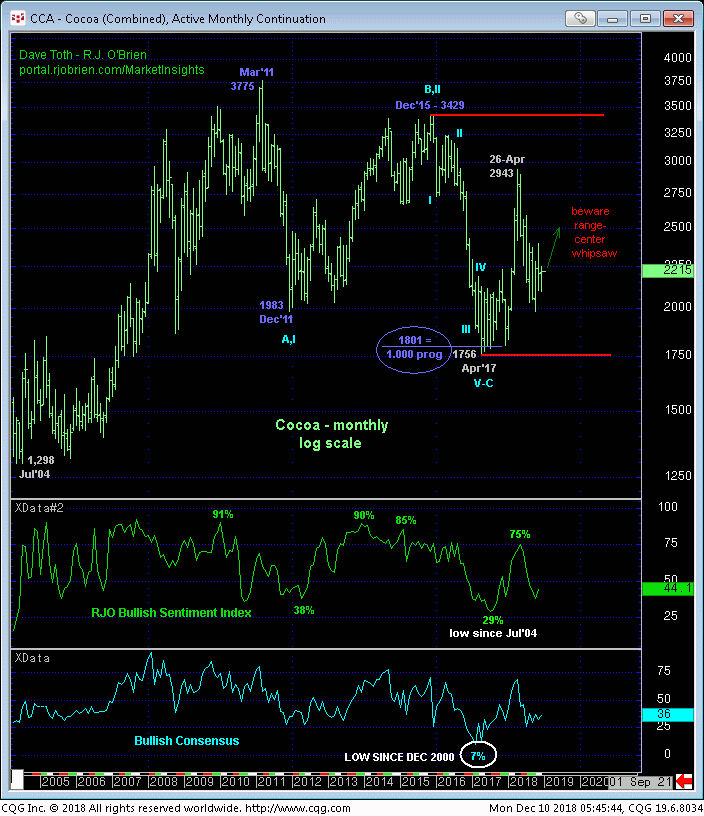
The monthly log chart below shows the market towards the lower-quarter of a range that goes back about 10 years. Nov’17’s bullish divergence in momentum broke 2015-17’s downtrend and exposed the latest intra-10-year-range rebound to Apr’s 2943 high. Until Apr’17’s 1756 low is broken, relapses like Apr-Oct’18’s 2943 – 1982 break are arguably corrective buying opportunities.
Market sentiment levels have eroded to relatively pessimistic levels that would seem to better reinforce a vulnerability to higher prices rather than lower ones. Combined with Fri’s bullish divergence in momentum that identifies a relatively tight but objective risk parameter at 2095, a cautious bullish policy and exposure are advised with a failure below 2095 required to negate this very specific call and warrant its cover. We provide a cautious call-diagonal strategy below.
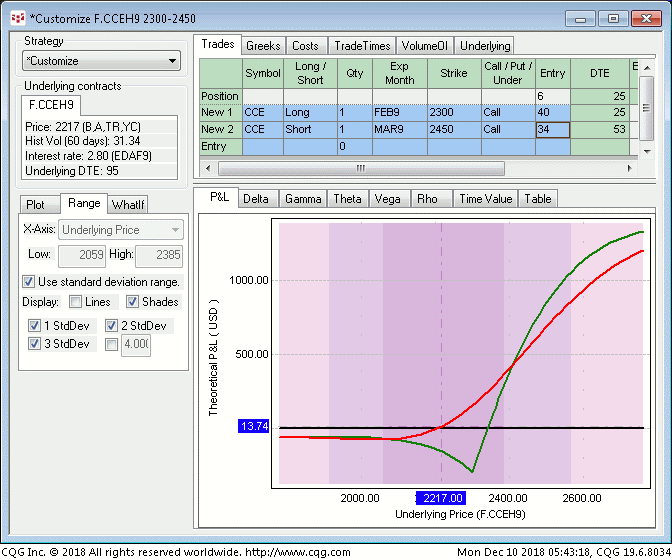
The Feb 2300 / Mar 2450 call diagonal spread looks to cost around six ticks ($60/1-lot punt) and provides:
- a current net delta of +0.13
- gamma ratio of 2:1
- negligible risk if the market sells off sharply
- profit potential of 144 ticks ($1,440 per 1-lot punt) on a sustained rally above 2450.
As always with long-gamma strategies, time, or theta risk is what comes in exchange for the long-gamma benefits. The Feb options expire in 25 days (04Jan19), and if the market doesn’t make a strong move higher before then, the risk is that the long Feb calls expire worthless, leaving a naked short call position in the Mar options. This would obviously expose infinite risk if the market were to rally later than sooner. But this predicament and risk should never come to pass as this strategy should be covered for what should be a small loss a week or 10 days prior to the Feb option expiration if the market doesn’t rally sharply or if the underlying Mar contract fails below 2095.
Please contact your RJO representative for an updated bid/offer quote on the Feb 2300 / Mar 2450 call diagonal spread.
