Posted on May 23, 2023, 08:01 by Dave Toth
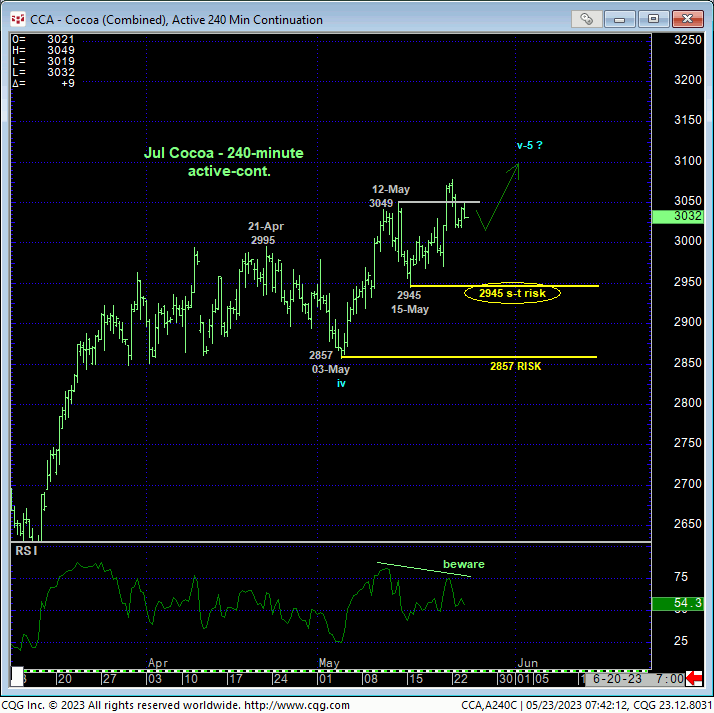
The 240-min chart below shows Fri’s break above 12-May’s 3049 high confirming not only a new high for the month of May, but also a new high for a secular bull market that now spans SIX YEARS. The important by-products of this latest spate of strength are the market’s definition of smaller- and larger-degree corrective lows at 2945 and 2857, respectively, that the market is now required to sustain gains above to maintain a more immediate bullish count. Its failure to do so will confirm bearish divergences in momentum on two different scales that, along with historically frothy sentiment levels, would defer or threaten a bullish policy and exposure enough to warrant defensive measures. Per such, 2945 and 2857 are considered our new short- and long-term parameters from which the risk of a still-advised bullish policy and exposure can be objectively rebased and managed.
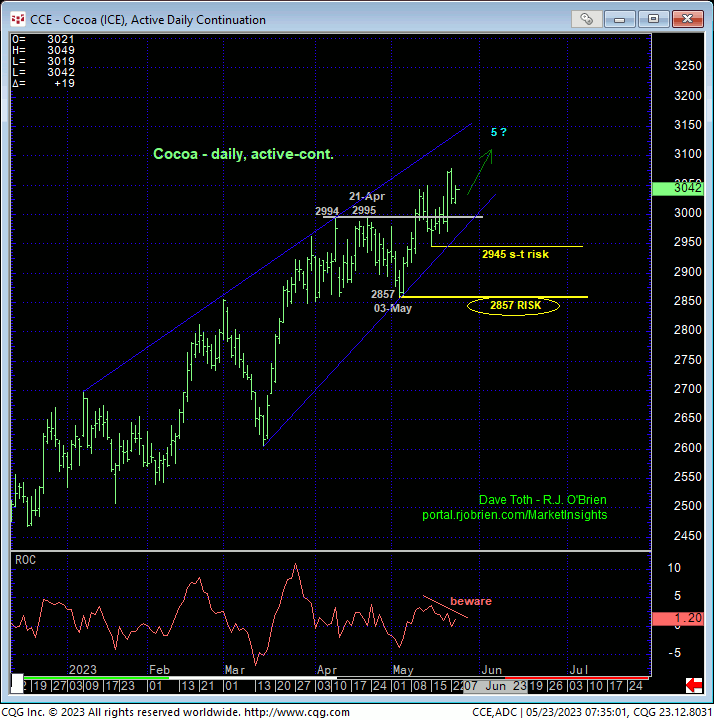
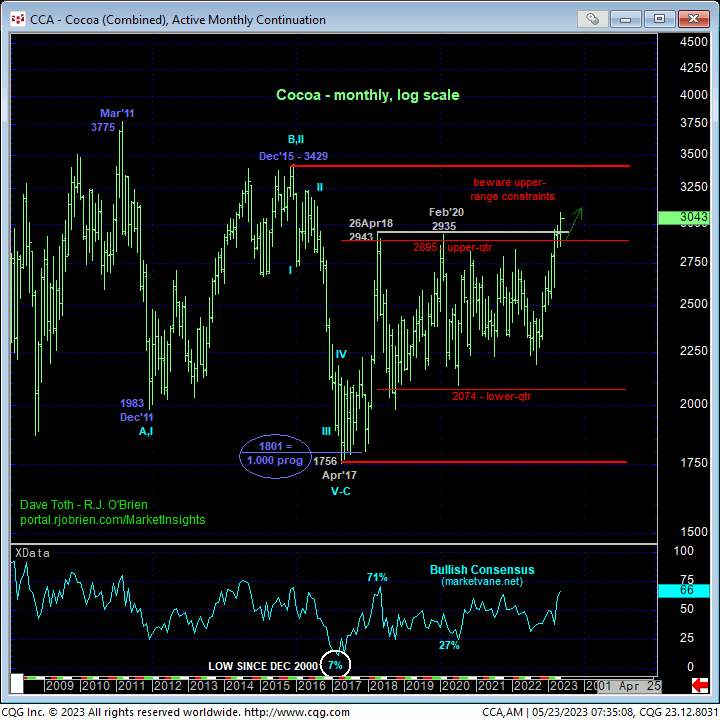
Only a glance at the daily (above) and weekly (below) charts is needed to see the magnitude of the secular bull trend from even last Sep’s 2192 low. The challenge to analyzing this rally is that there are so many iterative stair-steps within this clear and present and major uptrend that it renders any attempt at an Elliott count futile. But that’s OK, because in the end and at this stage of such a major bull trend, the only thing that matters is MOMENTUM. ONLY a confirmed bearish divergence in momentum will suffice in effectively managing the inevitable top to this bull, NOT a perceived 5-wave Elliott count. And with a confirmed bearish divergence in momentum defined precisely by either a failure below a prior corrective low or an initial counter-trend low, herein lies the crucial importance of identifying recent corrective lows and risk parameters like 2945 and 2857.
While we’re not endeavoring to count the waves up from Sep’22’s 2192 low, what could prove important in the daily chart above is the prospect of a developing “rising-wedge” pattern noted by the blue trend lines. Such a pattern could be a 5th-wave diagonal triangle that often times completes a sequence.
It’s been our experience over the decades that such rising-wedge structures typically mean one of two things:
- waning strength ahead of a major reversal, or
- a sort of “coiling-up” before the trend goes ballistic.
IF the latter, ballistic count is what this market has in mind, it should be able to sustain trendy, impulsive behavior above recent corrective lows and risk levels like 2945 and especially 2857. Its failure to do so will confirm bearish divergences in momentum and warn of a peak/correction/reversal threat that could be major in scope, especially given FIVE-YEAR highs (71%) in the Bullish Consensus (marketvane.net) measure of market sentiment shown in the weekly chart below.
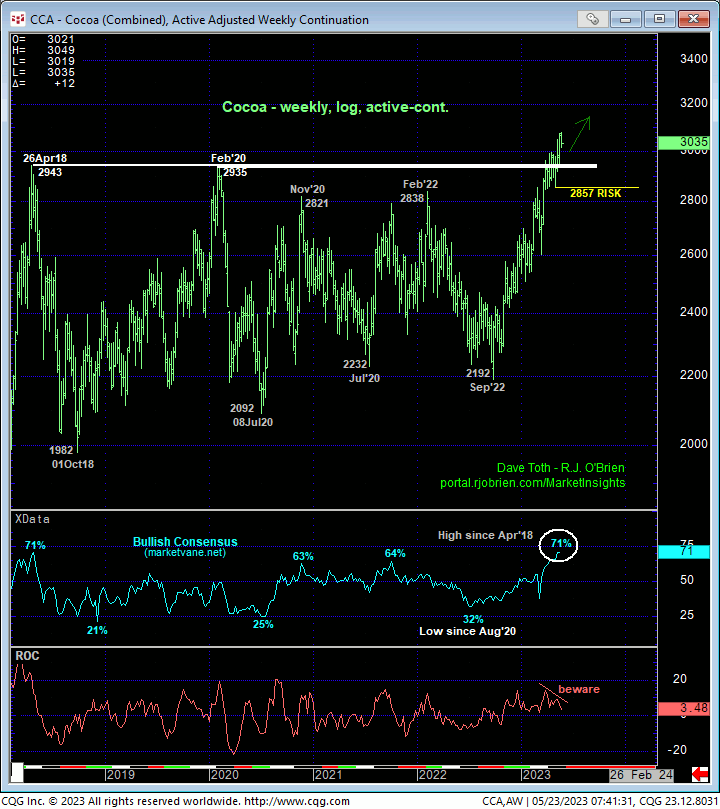
Lastly and on an even longer-term scale, the monthly log chart below shows this market’s engagement of the upper-quarter of its massive but lateral historical range. If there’s a time and place to be leery of a major top, it is here and now. But with the trend up on all scales and NO levels of any technical merit between spot and 2015’s 3429 high, further and possibly accelerated gains remain expected, with proven weakness below our two risk parameters cited above required to defer or threaten this bullish call.
These issues considered, a bullish policy and exposure remain advised with a failure below 2945 required for shorter-term traders to move to the sidelines and commensurately larger-degree weakness below 2857 required for longer-term commercial players to follow suit. In lieu of such weakness, further and possibly accelerated gains remain expected.