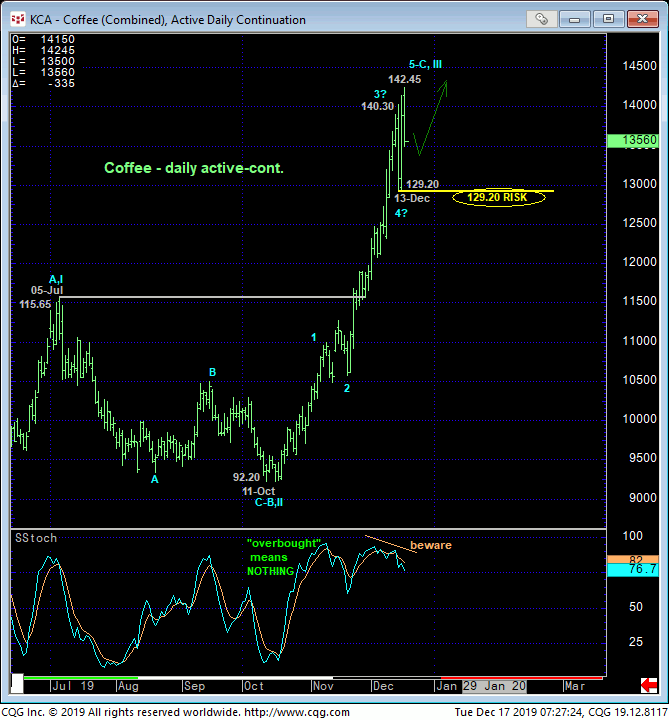
Whenever applicable, like with Nov-Dec’s explosive, relentless rally, we never miss the opportunity to bash references to a market being “overbought”. In navigating the opportunistic ends of trends, we always discuss how a trend typically slows down before that final gasp and failure that satisfies a true momentum divergence condition.
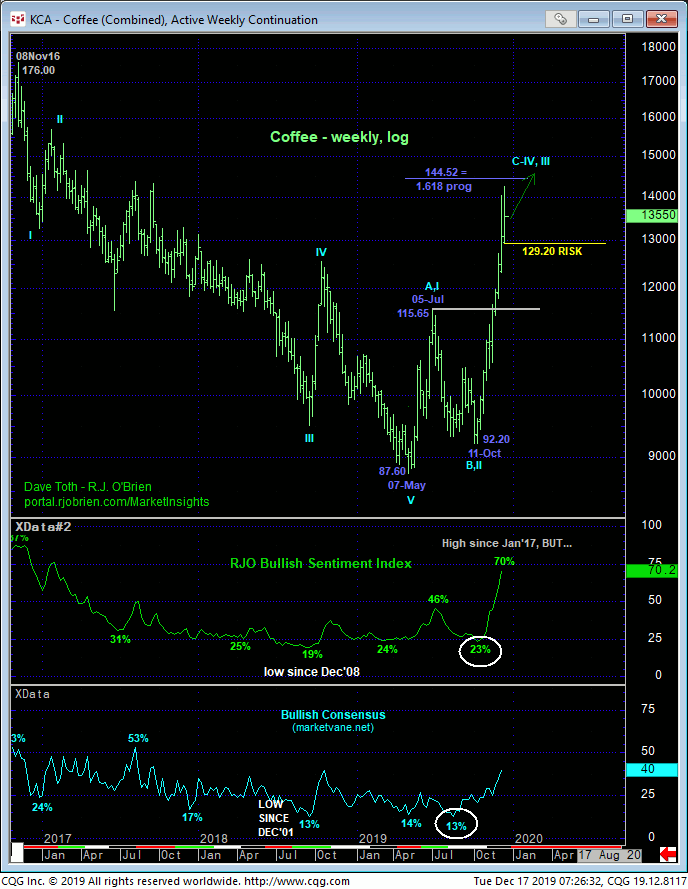
The 240-min chart shows a textbook example of this setup following Fri’s relatively sharp setback to a 129.20 low AND resumption of the bull to a new high above Fri morning’s 140.30 high that confirms Fri’s 129.20 low as a specific and objective corrective low the market now needs to sustain gains above to maintain the clear and present uptrend and a continued bullish count. Its failure to do so will CONFIRM a bearish divergence in momentum, break the uptrend and expose at least a larger-degree correction lower. Per such, this 129.20 level becomes our new key risk parameter from which both short- and longer-term traders can objectively rebase and manager the risk of a still-advised bullish policy and exposure.


Adding intrigue to a peak/correction/reversal threat is the prospect that Fri’s setback is the 4th-Wave of a complete or nearly complete 5-wave Elliott sequence from 11-Oct’s 92.20 low. A failure below 129.20 would reinforce such a count and expose at least a larger-degree correction lower. And given the extent and uninterrupted nature of Oct-Nov’s explosive rally that left nothing in the way of former battlegrounds that might now be looked to as support candidates, even a correction’s downside potential below 129.20 would have to be approached as indeterminable and potentially relatively steep.
Additionally and understandably, market sentiment/contrary opinion indicators have ballooned out to levels not seen in at least a year, and in the case of our RJO Bullish Sentiment Index, in nearly three years. As always however, sentiment is not an applicable technical tool in the absence of an accompanying bearish (in this case) divergence in momentum. A failure below 129.20 however would break the uptrend and, along with this sentiment spike, leave the market vulnerable to a correction or reversal lower of “enough” scope that we believe is best avoided by even long-term players.

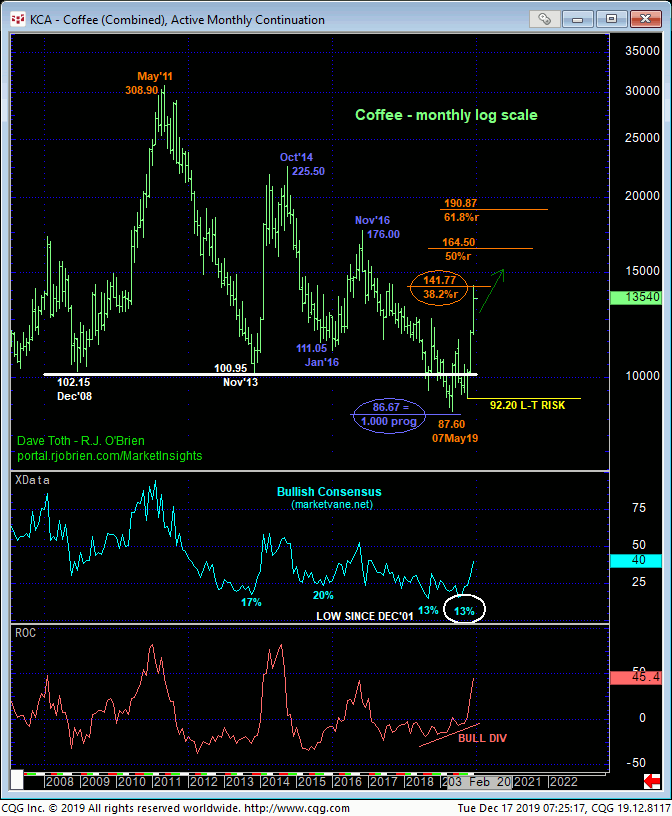
Finally and adding still further intrigue to even an interim peak/correction count, the MONTHLY log scale chart below shows today’s 142.45 high being just a few ticks away from the (141.77) 38.2% retrace of the secular bear market from May 2011’s 308.90 high to May’19’s 87.60 low. This very interesting but merely derived technical level means absolutely nothing in the absence of a confirmed bearish divergence in momentum. But again, a failure below Fri’s 129.20 low would confirm such a momentum divergence and render this Fib relationship as well as sentiment and wave structure applicable to a peak/correction/reversal-threat environment.
These issues considered, a bullish policy and exposure remain advised with a failure below 129.20 required to defer or threaten this call enough to warrant moving to a neutral/sideline position and circumventing the depths unknown of a larger-degree correction or reversal lower. In lieu of such sub-129.20 weakness, the trend remains up on all scales and should not surprise by its continuance.


