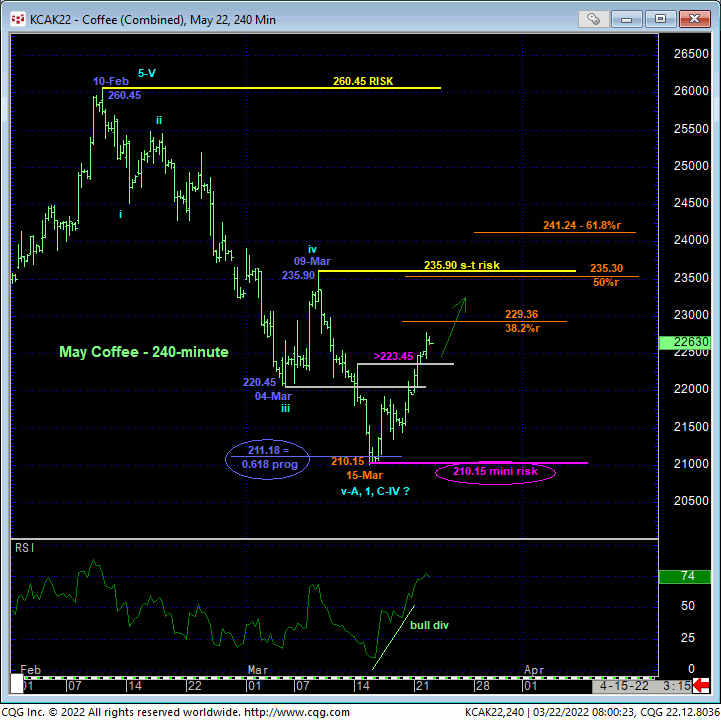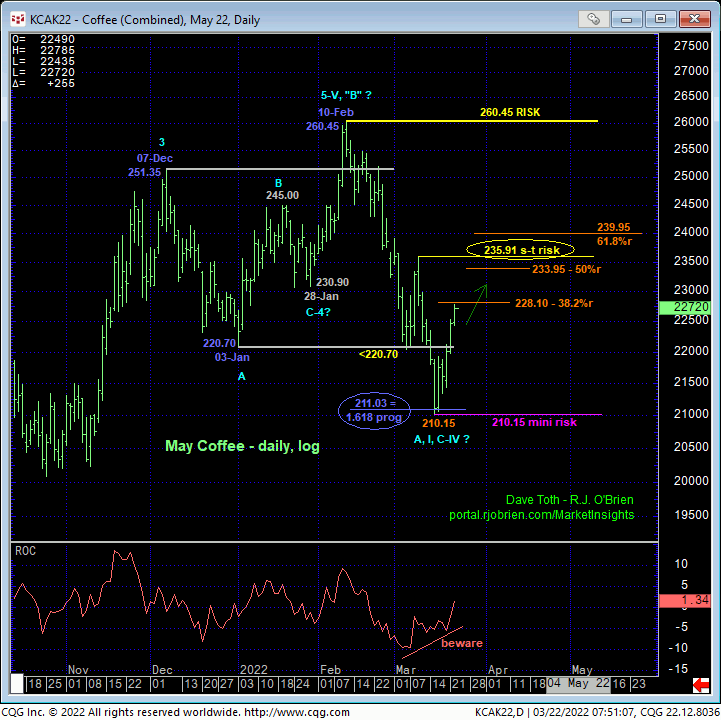
In last Wed’s Technical Webcast we identified 14-Mar’s 223.45 minor corrective high as a mini risk parameter the market needed to sustain losses below in order to maintain a more immediate bearish count. Its failure to do so yesterday confirms a bullish divergence in very short-term momentum that defines 15-Mar’s 210.15 low as one of developing importance and possibly the end of a textbook 5-wave Elliott sequence down from 10-Feb’s 260.45 high. Per such, we’re reinforcing last week’s 210.15 low as a tight but objective risk parameter from which non-bearish decisions like short-covers and cautious bullish punts can be objectively based and managed.
Commensurately larger-degree strength above 09-Mar’s 235.90 next larger-degree corrective high remains arguably required to, in fact, break Feb-Mar’s entire downtrend and confirm a bullish divergence in DAILY momentum. But given that this level is pretty much in the middle of the past month’s range bounded by 10-Feb’s obviously important 260.45 high and last week’s increasingly important 210.15 low and is thus a less optimum technical level, we urge shorter-term traders to rely more on last week’s 210.15 low as a pertinent and practical threshold around which to toggle directional biases.


From a longer-term perspective, it is vital to note that there remain key technical elements BOTH WAYS. Factors contributing to a major PEAK/reversal threat include:
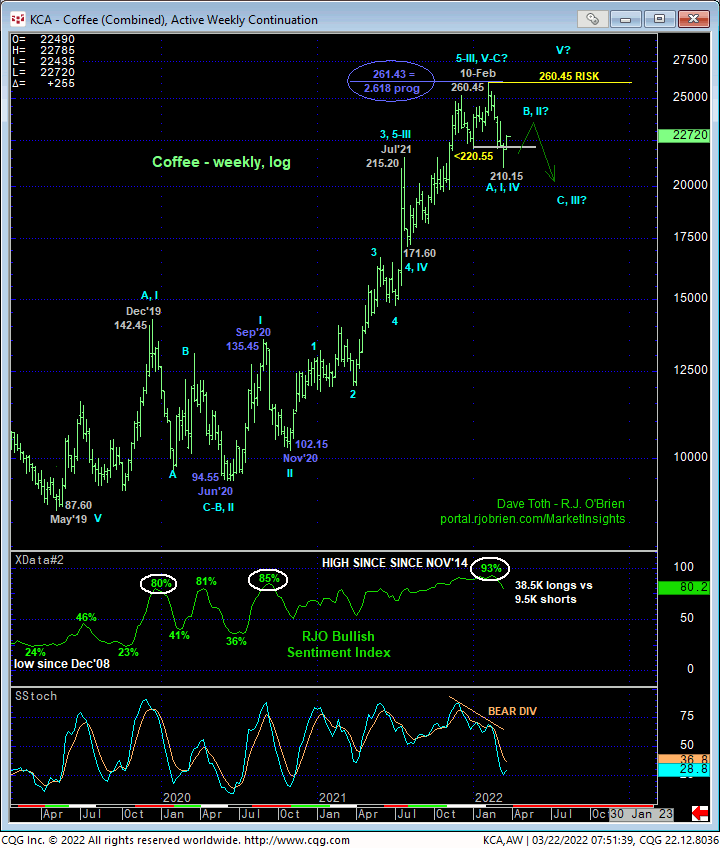
- a confirmed bearish divergence in WEEKLY momentum shown below that satisfies the first of our three key reversal requirements
- recent historically frothy levels in our RJO Bullish Sentiment Index of the hot Managed Money positions reportable to the CFTC
- an arguably complete and major 5-wave Elliott sequence up from at least Nov’20’s 102.15 low and possibly Jun’20’s 94.55 low
- proof of trendy, impulsive 5-wave price action down from 260.45 to 210.15 that satisfies the second of our three key reversal requirements, and
- the Fibonacci fact that the rally from Nov’20’s 102.15 low spanned a length almost exactly 2.618% longer than Jun’Sep’20’s initial rally from 94.55 to 135.45.
IF 10-Feb’s 260.45 completed the major bull and a major peak/reversal process is unfolding, then by definition this market now needs to satisfy the important third of our three key reversal requirements: proof of 3-wave corrective behavior on this subsequent recovery attempt that is stemmed by another bearish divergence in momentum from a level shy of 10-Feb’s 260.45 high. This is a crucial requirement to keep in mind as it will protect longer-term traders from shorting this market prematurely per an alternate bullish count that could see this market resume its secular bull trend to new highs above 260.45.
Long-term bullish factors include:
- the magnitude of the secular bull trend
- the size of an arguable correction that dates from 07-Dec’s 251.35 high that falls well within the bounds of a mere (4th-Wave) correction within the secular bull in which
- the prospective C-Wave down from 10-Feb’s 260.45 B-Wave “irregular” high spanned a length within a penny of the (211.03) 1.618 progression of Dec-Jan’s prospective A-Wave decline from 251.35 to 220.70 as labeled in the daily log scale chart above.
IF this latter count is correct, then we would expect to see sustained, trendy, impulsive price action higher to new highs above 260.45. If a broader peak/reversal process is unfolding, the totally expected B- or 2nd-Wave corrective rebuttal to Feb-Mar’s A- or 1st-Wave decline should not surprise by its “extensive” nature in terms of both price AND TIME in the weeks ahead with a 61.8% retrace (to the 239.95-area) or more.
These issues considered, traders are advised to move to a cautious bullish policy ahead of at least a potentially extensive corrective rebound and possibly a resumption of the secular bull market. A relapse below 210.15 is required to negate this call and reinstate a peak/reversal process that we believe could be major in scope. We will be watchful a recovery-stemming bearish divergence in momentum in the 234.00-to-240.00-range needed to arrest the recovery and expose what could a major risk/reward selling opportunity. In lieu of such a bearish divergence in momentum, traders are urged not to underestimate the extent to which this market might correct/recover or even reinstate the secular bull trend.


