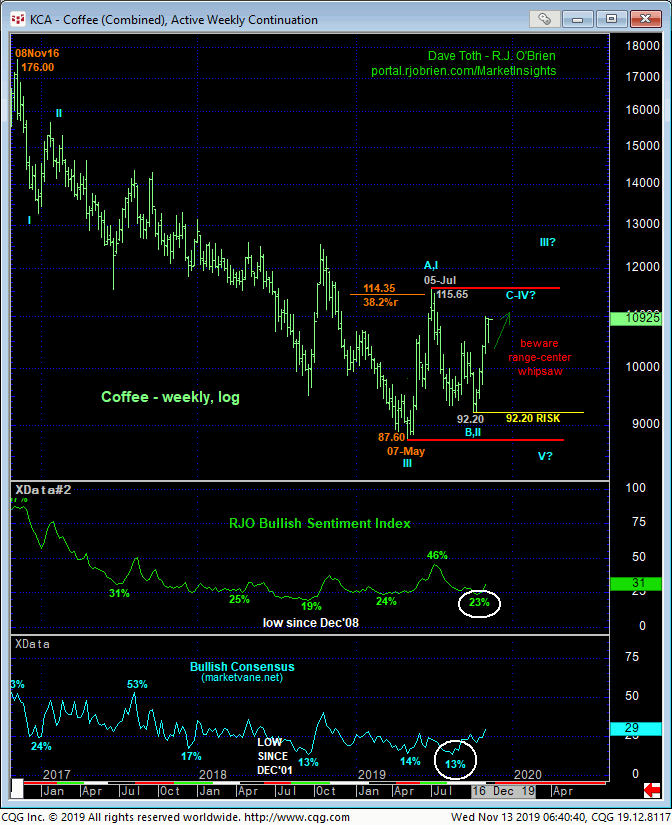
Ever since late-May’s bullish divergence in weekly momentum amidst historically bearish sentiment conditions, our analysis has centered around the not uncommon dilemma and debate as to whether the price action from 07May19’s 87.60 low is that of a major base/reversal environment OR merely a major correction within the secular bear trend. When the market was wafting around the lower-quarter of this range like last month, a bullish divergence in momentum presented a favorable risk/reward condition from which bullish decisions could be objectively based and managed. Now that the market has returned to the upper quarter of this year’s range, traders must acknowledge and be flexible to a significant move EITHER WAY; either a rejection/failure from the upper-quarter of the range that would reinforce the bear market correction count OR proof of sustained, trendy, impulsive behavior “up here” that would be a critical requirement of the major base/reversal count.
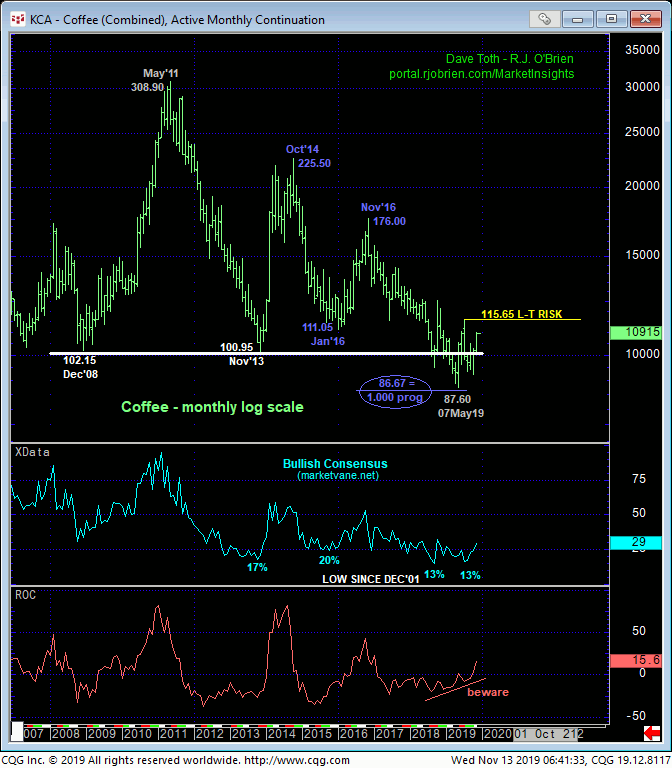
The weekly (above) and monthly (below) log scale charts still show sentiment/contrary opinion levels near historically low levels that would seem to reinforce a broader bullish count. By the same token, 05-Jul’s 115.65 obviously key high remains intact as the resistant gateway to a major reversal.
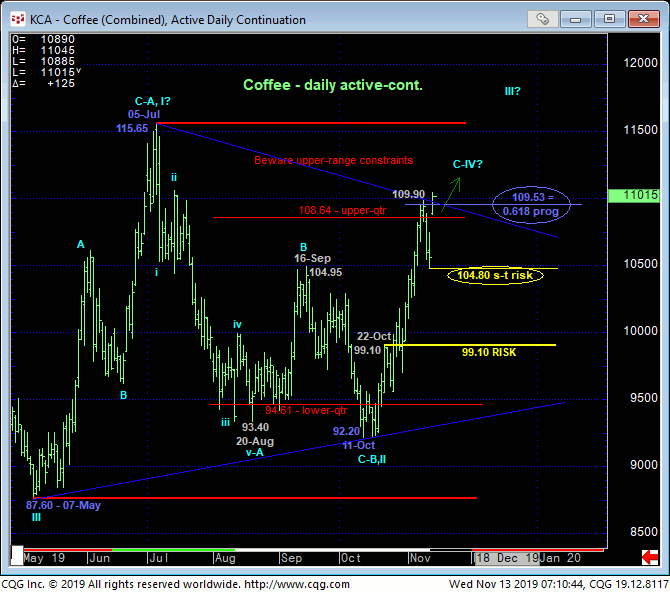
On an active-continuation basis, the daily chart above shows the market’s recent poke to the (108.65+) upper-quarter of this year’s range. IF the price action from May’s 87.60 low is just a correction, the upper-quarter of this year’s range is a key area to be watchful for waning strength, a rollover and at least another intra-range relapse, if not a resumption of the 8-YEAR secular bear market. It’s also interesting to note in this active-continuation chart that the past month’s rally has spanned a length that 61.8% (i.e. 0.618 progression) of May-Jul’s preceding 87.60 – 115.65 rally. Such a Fibonacci progression relationship is common in corrective lateral triangle formations.
Adding to this market’s trickiness “up here” is the fact that the futures market has rolled to Mar today as the new prompt contract. The daily chart of the Mar contract below shows the clear and present uptrend as well as this uptrend’s stall-out around the (112.52) 61.8% retrace of Jul-Oct’s 122.85 – 95.80 decline. Despite these Fibonacci relationships however, a confirmed bearish divergence in momentum remains required, even “up here”, to arrest the clear and present uptrend and reject/define a more reliable high and resistance from which we can then prepare for another intra-range relapse or worse.
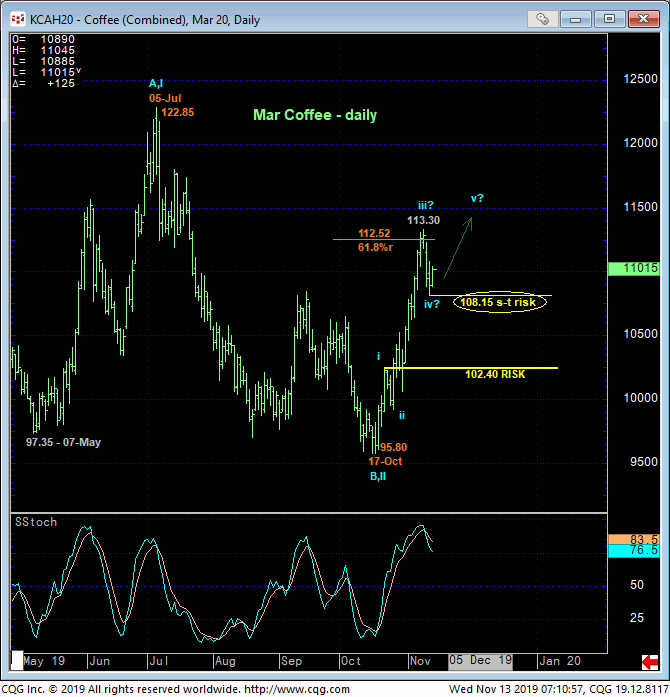
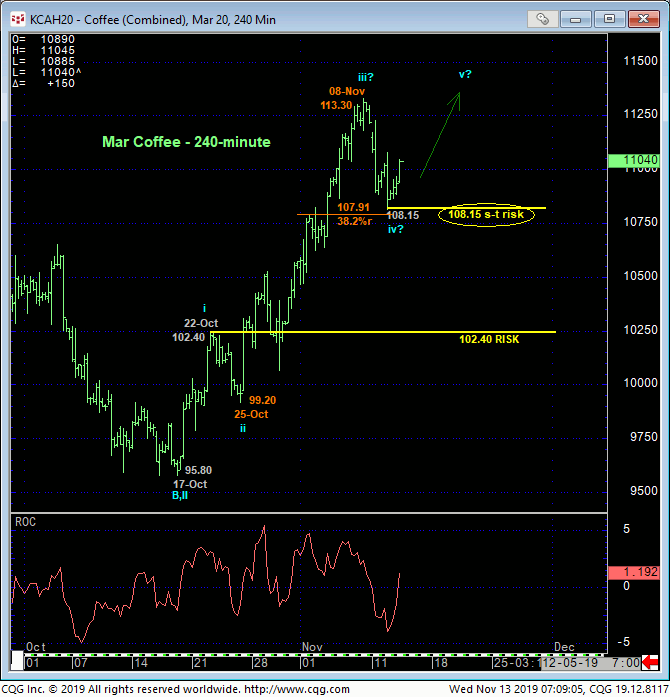
Drilling down to an intra-day 240-min chart of the Mar contract and given what we’re approaching as a slippery slope for bulls at the upper-quarter of this year’s range that we believe warrants a more conservative approach to bullish exposure, we’re (admittedly prematurely) identifying yesterday’s 108.15 low as the end or lower boundary of a suspected (4th-Wave) correction the market now needs to sustain gains above to maintain a bullish bias and count “up here”. A failure below 108.15 won’t necessarily confirmed a more protracted intra-range relapse or worse, but it would at least reaffirm the intermediate-term downtrend. And again, from “up here”, we believe a more conservative approach to risk assumption that comes in exchange for whipsaw risk is preferred to the alternative of the next pertinent larger-degree downside threshold that looks to be yesterday’s 104.80 low in the Dec contract.
In sum, there’s a lotta moving parts and considerations and traders are advised to be flexible to a bigger directional move EITHER WAY from the current upper-quarter of this year’s range. We maintain a bullish bias and policy with a failure below 108.15 in the now-prompt Mar contract the next sign of weakness and vulnerability that could expose a more protracted, if intra-range relapse and warrant defensive steps commensurate with one’s personal risk profile. In lieu of such weakness, further and possibly surprising, accelerated gains should not surprise with 05-Jul’s 115.65 high an obviously key threshold the bull needs to break to reinforce a base/reversal count that could be huge in scope.
