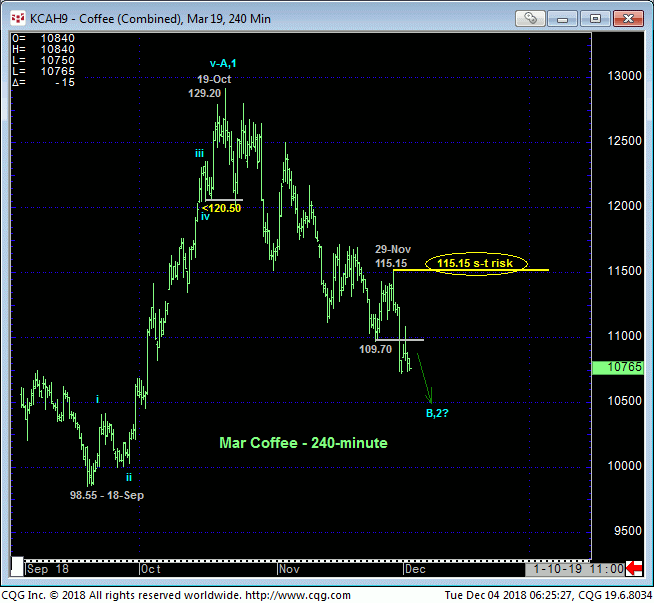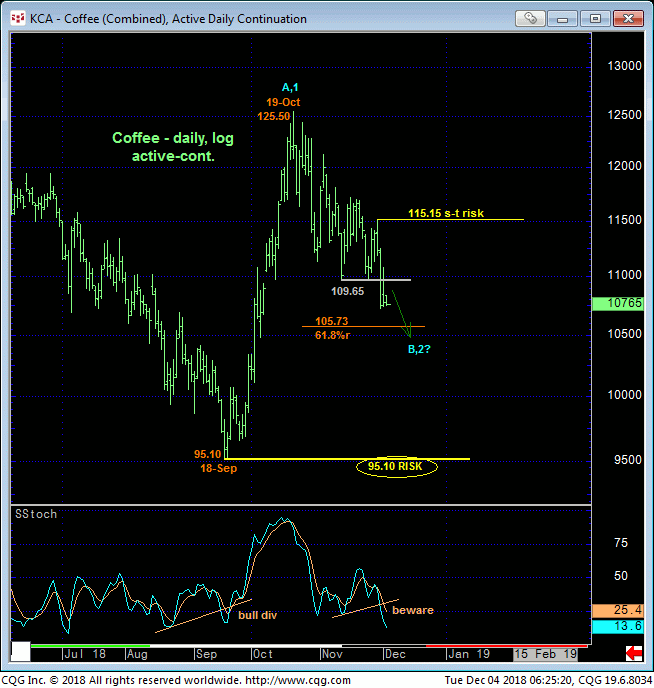
Fri’s break below 26-Nov’s 109.70 low maintains the simple, steady downtrend pattern of lowers lows and lower highs and leaves Thur’s 115.15 high in its wake as the latest smaller-degree corrective high this market is now required to recover above to break this pattern and expose at least an interim correction higher. In this regard this 115.15 level serves as our new short-term risk parameter from which traders can rebase and manage the risk of a bearish policy and exposure.


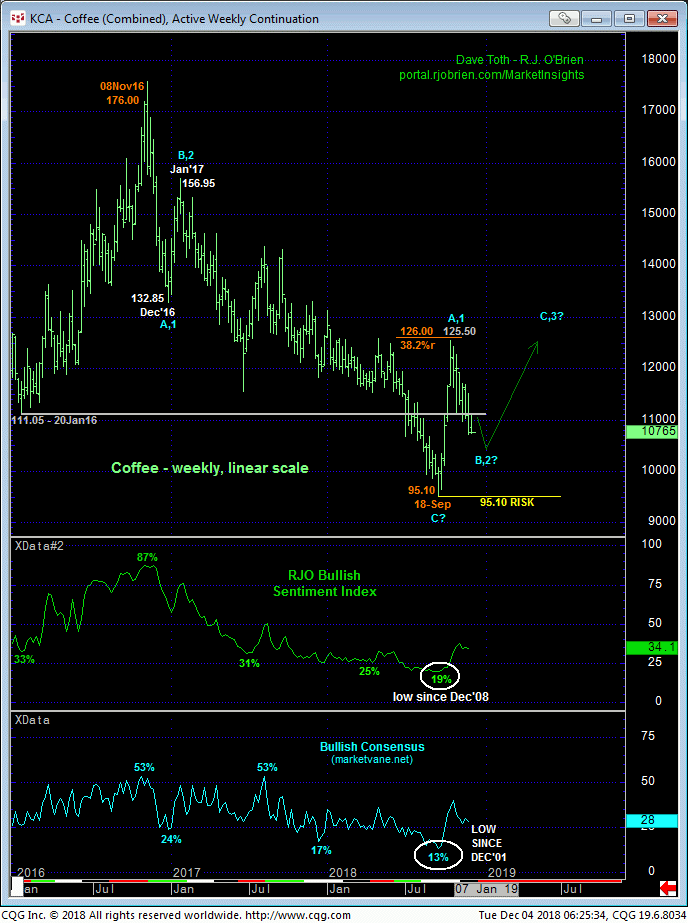
In 23-Oct’s Technical Blog following that morning’s momentum failure below 12.50, we discussed the prospect for a rather extensive correction lower given 1) the extent and uninterrupted nature of Sep-Oct’s rally and 2) the fact that such an “obvious” move stemmed directly from the lowest prices in over 10 years. Noting that the massive bearish forces that drove the secular bear trend aren’t likely to evaporate quickly, an often times extensive corrective rebuttal to the initial counter-trend rally is typical of most base/reversal processes. “Extensive” may be a relative term, but we typically gauge such corrections around the 61.8% retrace of the initial counter-trend rally. In this case that 61.8% retrace of Sep-Oct’s 95.10 – 125.50 rally cuts across at 105.73.
Traders are reminded however that such merely “derived” technical levels like Bollinger Bands, imokus, trend line, the ever-useless moving averages and even the vaunted Fibonacci relationships we cite often in our analysis NEVER have proven to be reliable reasons to define support (or resistance) in the absence of an accompanying confirmed bullish (in this case) divergence in momentum. And they never will as the momentum “tail” never, ever wags the underlying market “dog”.
Herein lies the importance of identifying a specific, market-defined corrective high like 115.15 that the market must now recoup to, in fact, break the clear and present downtrend, regardless of whether the market rejects a “Fibonacci level” or anything else. And until or unless such objective proof of strength is shown, at least the intermediate-term trend remains down and should not surprise by its continuance or acceleration as the market has exposed an area totally devoid of any technical levels of merit shy of 18-Sep’s 95.10 low. In effect, there is no support shy of 95.10. This doesn’t mean we’re forecasting a move to 95.10, but it certainly does mean that until and unless the market recovers above 115.15, ANY amount of downside is in play, including a run at or even below 95.10.
In sum, a bearish policy and exposure remain advised with a recovery above 115.15 required to negate this call, resurrect a base/reversal process that could be major in scope and warrant a shift back to the bull side. In lieu of such 115.15+ strength, further and possibly accelerated losses remain expected.


