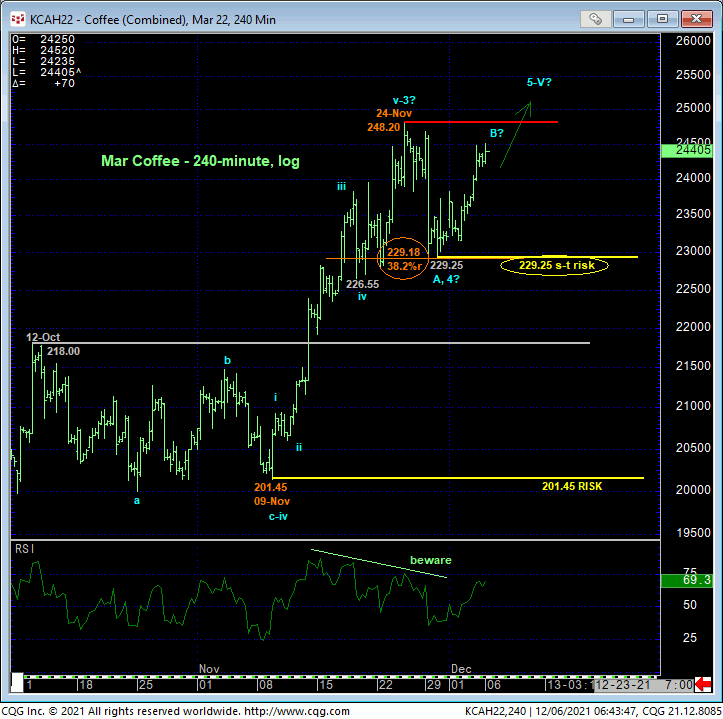
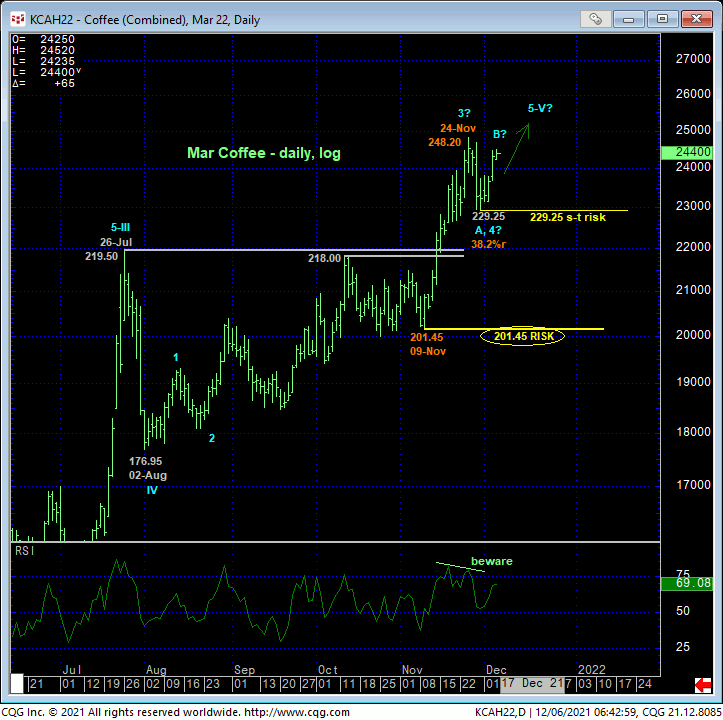
While the market hasn’t eclipsed 24-Nov’s 248.20 high and resistance needed to reaffirm the secular bull trend, we believe the extent of the past few days’ recovery from 30-Nov’s 229.25 low renders that low the end or lower boundary of another correction within the major bull trend ahead of its eventual resumption above 248.20. The backdrop of the massive secular bull trend and fact that this 229.25 level is just a few grounds away from the Fibonacci minimum (229.18) 38.2% retrace of Nov’s latest portion of the secular bull from 201.45 to 248.20 would seem to reinforce this bullish count. Per such, we’re defining 229.25 as our new short-term risk parameter from which shorter-term traders can objectively rebase and manage the risk of a still-advised bullish policy and exposure.
From a longer-term perspective, and again, given the magnitude of the secular bull trend, commensurately larger-degree weakness below 09-Nov’s 201.45 larger-degree corrective low remains MINIMALLY required to threaten the secular bull trend to the point of non-bullish action by even long-term commercial players. What the market might have in store between 229.25 and 201.45 IF the market fails below 229.25 is anyone’s guess, with former 218-to-219-area resistance-turned-support candidate between these two flexion points. For longer-term players who don’t prefer or can’t risk bullish exposure to 201.45, you’re only objective option is to pare or neutralize exposure on a failure below 229.25 and acknowledge and accept whipsaw risk (back above whatever high is left in the wake of such a momentum failure) in exchange for much deeper nominal risk below 201.45.
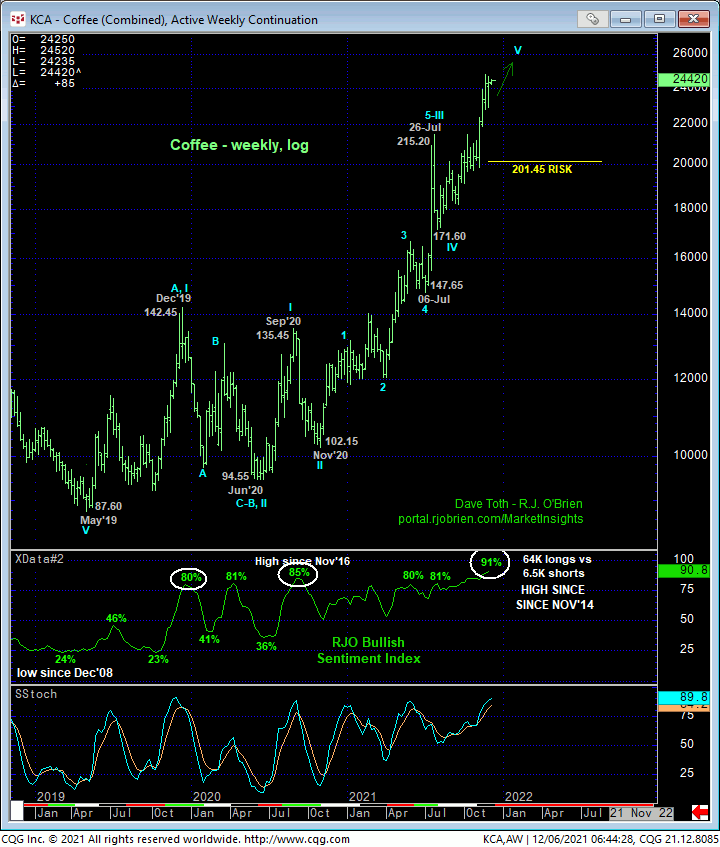
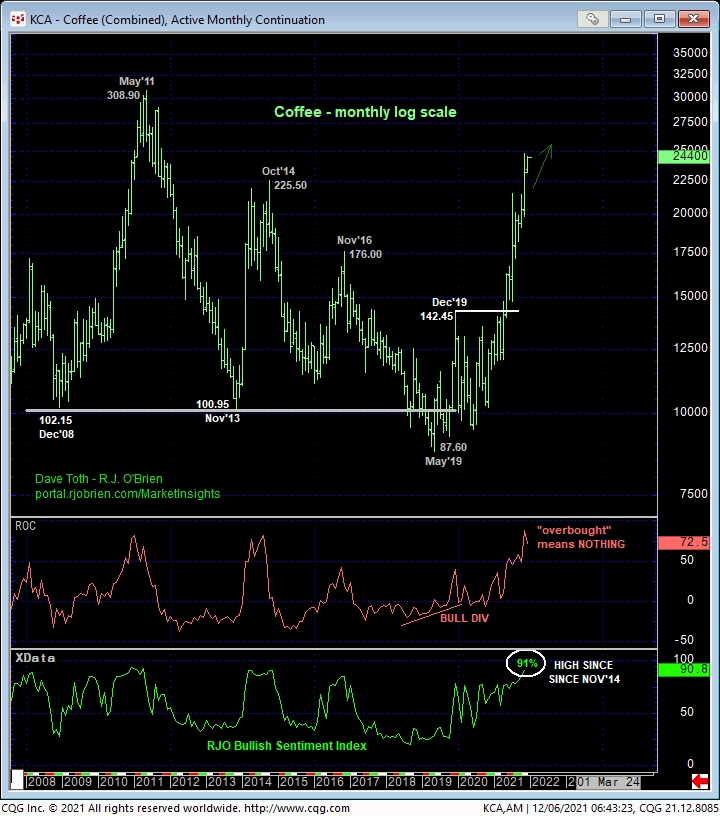
From a much longer-term perspective, the magnitude of the secular bull trend is crystal clear in the weekly (above) and monthly (below) log scale charts with NO levels of any technical merit shy of 2011’s 308.90 all-time high. This doesn’t mean we’re forecasting a move to 308. But it certainly does mean that until and unless this market confirms a bearish divergence in momentum of a scale sufficient to threaten this massive bull, upside potential remains indeterminable and potentially extreme, including a run at 308. Herein lies the importance of identifying specific corrective lows and risk parameters like 229.25 and 201.45.
Understandably, market sentiment/contrary opinion levels remain as stratospheric levels not seen since Nov 2014. Such frothy levels are typical of major PEAK/reversal environments. But we would remind traders that contrary opinion is not an applicable tool in the absence of an accompanying confirmed bearish divergence in momentum of a scale sufficient to even threaten the major uptrend, let alone break it. Here too is the importance of corrective lows like 201.45 and even a much tighter 229.25 levels.
These issues considered, a bullish policy and exposure remain advised with a failure below 229.25 require for shorter-term traders to move to the sidelines to circumvent the depths unknown of a larger-degree correction and for even longer-term commercial players to pare exposure to more conservative levels. In lieu of such weakness, further and possibly accelerated gains are anticipated to another round of new highs above 248.20.