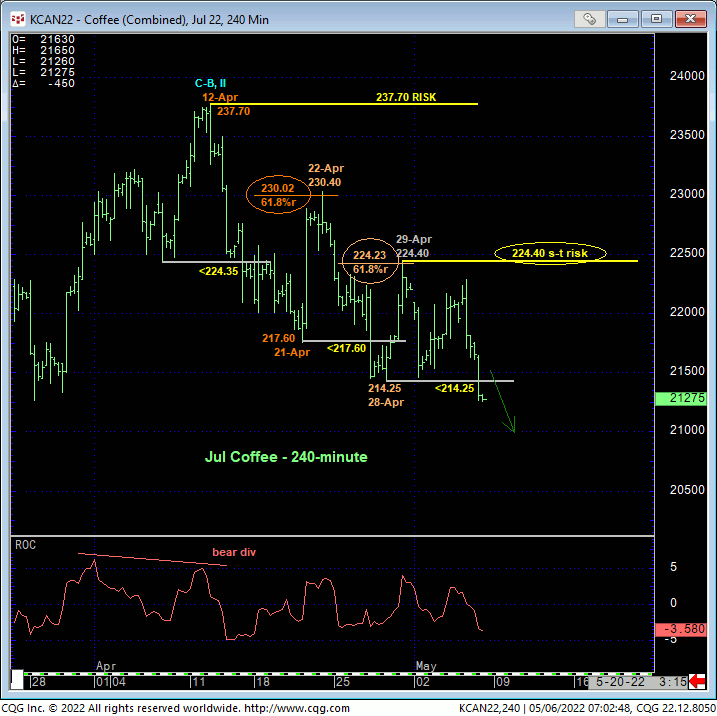
Overnight’s break below last week’s 214.25 low reinforces our broader peak/reversal count resurrected in 14-Apr’s Technical Webcast following that day’s bearish divergence in momentum below 07-Apr’s 224.35 low in the Jul contact and warns of potentially protracted losses straight away. This latest spate of weakness leaves 29-Apr’s 224.40 high in its wake as the latest smaller-degree corrective high this market is now minimally required to recoup to threaten this broader bearish count. Per such, 224.40 is considered our new short-term risk parameter from which shorter-term traders can objectively rebase and manage the risk of a still-advised bearish policy and exposure.
The relapse from 12-Apr’s 237.70 larger-degree corrective high and key long-term bear risk parameter has thus far been a very orderly one in which both recent recovery attempts failed at their 61.8% retraces of the preceding breaks. Per our broader peak/reversal count discussed below, we believe this warns of steep, protracted and more obvious losses in the period ahead until and unless threatened by a recovery above a corrective high and risk parameter like 224.40.


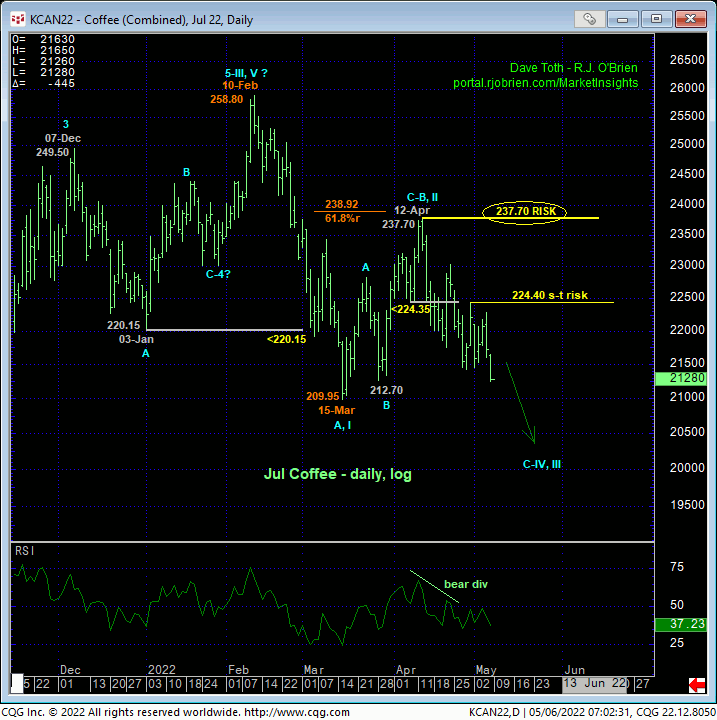
On a broader scale, today’s break below 28-Mar’s 212.70 low confirms Mar-Apr’s recovery attempt from 209.95 to 237.70 as a 3-wave and thus corrective affair. This fact satisfies the key third of our three reversal requirements following 1) early-Mar’s bearish divergence in WEEKLY momentum and 2) proof of trendy, impulsive 5-wave behavior in Feb-Mar’s initial counter-trend decline. Given these technical facts, we can now identify the decline from 12-Apr’s 237.70 high as either the C-Wave of a major correction or the dramatic 3rd-Wave of a major reversal lower. Either count warns of a break below 15-Mar’s 209.95 low and potentially precipitous losses thereafter. Commensurately larger-degree strength above 237.70 is required to negate either bearish count and re-expose the secular bull.
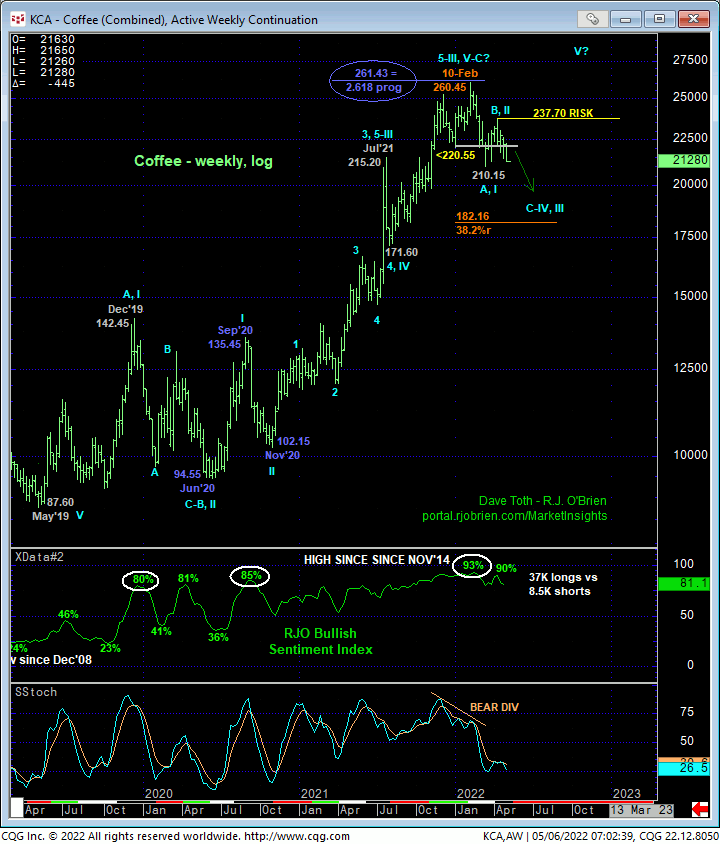
Given the magnitude of the secular bull trend from May’19’s 87.60 low, even a “precipitous” drop below 200.00 could still fall within the bounds of a major BULL market correction. Indeed, even the Fibonacci minimum 38.2% retrace of a prospective 3rd-Wave rally from Nov’20’s 102.15 low to 10Feb22’s 260.45 high doesn’t cut across until the 182.16-area. But given still-historically-skewed bullish levels in out RJO Bullish Sentiment Index of the hot Managed Money positions reportable to the CFTC, the extent to which this market is vulnerable below 15-Mar’s pivotal 209.95 is indeterminable and potentially severe.

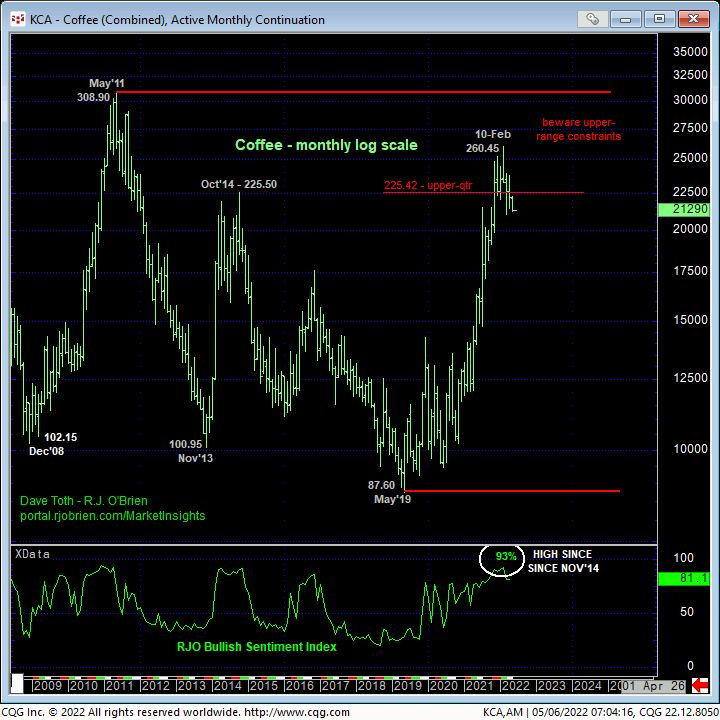
Finally and on an even broader monthly log scale below, the market’s failure to sustain gains into the upper-quarter of its historic range is another strike against a longer-term bullish policy “up here” on the heels of the past three months’ peak/reversal facts listed above. Can we CONCLUDE Feb’s 260.45 high as the end of the secular bull trend after relatively piddly weakness over the past three months? Obviously not given the magnitude of the nearly-three-year mega-bull. What we CAN conclude however are recent highs and risk parameters at 224.40 and especially 237.70 that the bull is now required to recover above to mitigate a major bearish count and resurrect a bullish count. Until and unless such strength is proven, all the elements typical of major peak/reversal environments are present and warn pf potentially protracted, even relentless losses in the weeks, months and perhaps quarters ahead.
These issues considered, a full and aggressive bearish policy and exposure remain advised with a recovery above 224.40 required for shorter-term traders to move to the sidelines and commensurately larger-degree strength above 237.70 required for longer-term commercial players to follow suit. In lieu of such strength, further and possibly steep, protracted losses are anticipated straight away.


